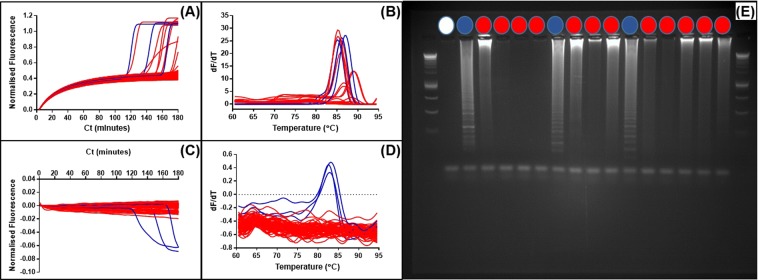
Figure 6.
Non-specific primer interactions detected with SYTO9 and JOE-FIP. Panel (A) shows the normalised fluorescence from SYTO9 detection and (C) shows the consecutive JOE-FIP fluorescence for NTCs. Corresponding melt curve analysis shown in panels (B,D). Negative results and SYTO9 detected positives are highlighted in red, JOE-FIP detected positives are highlighted in blue. One negative and all positives were examined on an agarose gel (E) for amplicons and the JOE-FIP detected positives showed a ladder pattern associated with LAMP amplification.

