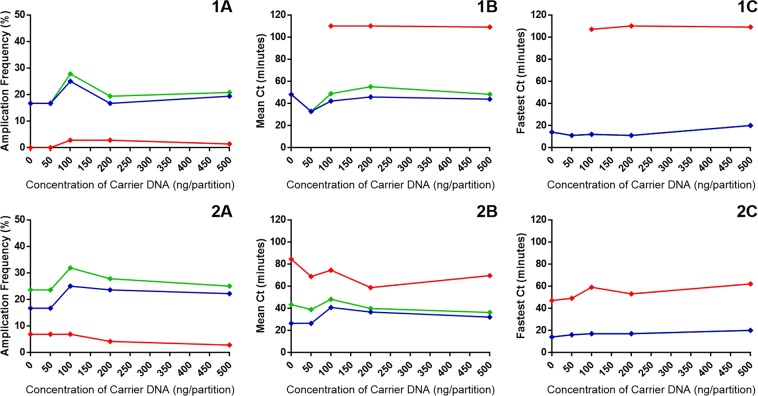
Figure 8.
Carrier DNA in LAMP amplification with SYTO9 and JOE-FIP detection. Panels (1A to C) represent amplification with the 35S promoter primers of a low concentration of denatured maize genomic DNA (5.0 percent maize GM event Bt11). Panels (2A to C) represent amplification of the same sample with the NOS terminator primers. Panels (A) show the amplification frequency for increasing concentrations of carrier DNA. Cycle threshold set for all assays at −0.005. Panels (B) show the average Ct values and panels (C) shows the fastest Ct values with increasing concentrations of salmon sperm carrier DNA. Green indicates SYTO9 derived values, blue indicates JOE-FIP derived values and red indicates ‘false positive’ results derived from the difference between the SYTO9 and JOE-FIP values. In panels 1C and 2C the SYTO9 and JOE-FIP values are identical.

