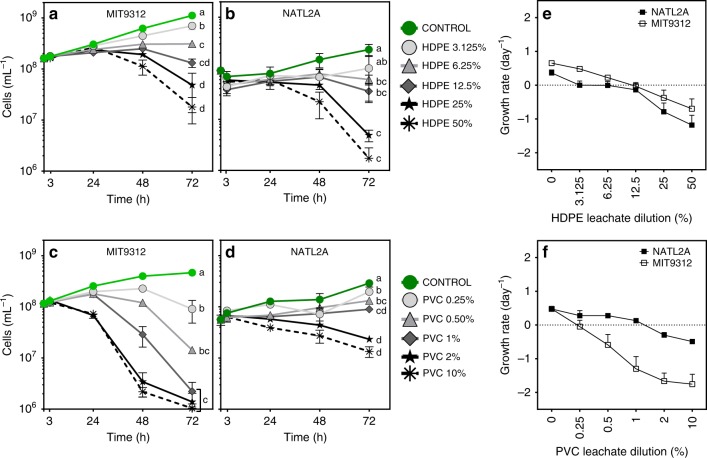
Fig. 1.
Population growth of Prochlorococcus MIT9312 and NATL2A in the presence of diluted HDPE and PVC leachates compared to 0% leachate control (AMP1 media). Growth curves (a–d) and growth rates (e, f) for each treatment are shown. Data points are mean values of triplicate biologically independent samples with error bars representing the standard deviation (error bars not visible where values were smaller than symbols). Lower case letters at the 72 h timepoints in a–d signify which treatments were found to be significantly different (p < 0.01) in population density at 72 h post exposure; source data and exact p-values for all timepoints are provided in Supplementary Data 1

