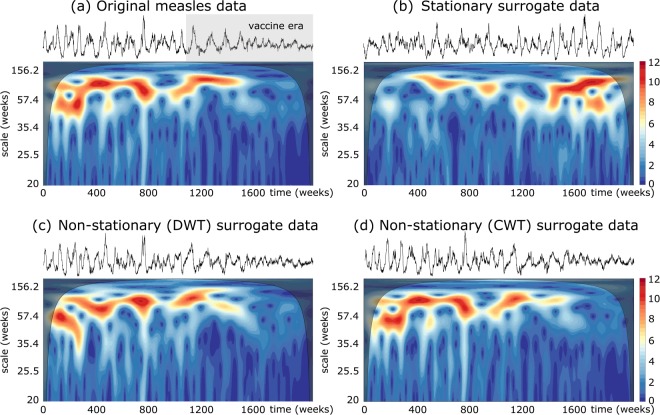
Figure 2.
Exemple of the TF structure for different surrogate algorithms applied to the squared root transformed measles data. Same stipulations as in the caption of Fig. 1. Wavelet analysis of measles data were done over the scale range 2–1000 weeks, spanned over 2496 scales. For better visualisation, spectra are displayed only scales larger than 20 weeks. Gray box in upper plot a indicates the vaccine era. Black transparent maps of time-frequency plots indicate the cone of influence that delimits the regions not influenced by edge effects (As the wavelet is centered close to the edges of time series, edge effects occur. The area of the TF plane where such effects are relevant, the so-called cone of influence, was chosen as the e-folding time of the Morlet wavelet function6).

