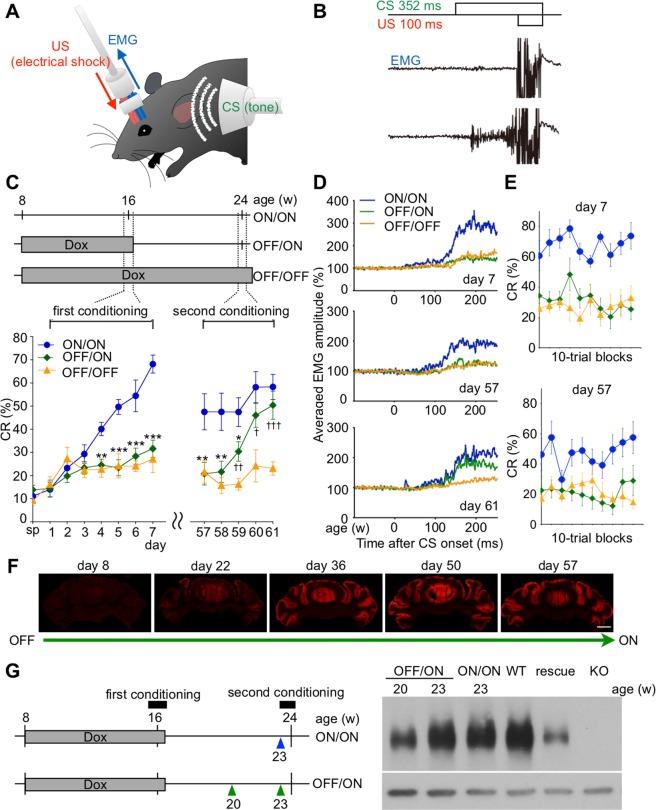
Figure 3.
Associative motor memory is not formed latently without mGluR1 in PCs of adult mice. (A) Scheme of an animal implanted with electrodes for recording the electromyographic activity. (B) Typical raw EMG recordings of mGluR1 cKO mice were described under the CS-US representations. Upper EMG is an example of raw EMG before conditioning. Lower EMG is an example of raw EMG confirmed as CR after conditioning. (C) Development of CR% in mGluR1 ON/ON mice (n = 10), mGluR1 OFF/ON mice (n = 10), and mGluR1 OFF/OFF mice (n = 10). Top panel indicates experimental design for the timing and period of eyeblink conditioning in the three mouse gropes. Gray boxes indicate the timing of DOX administration. Mouse age is indicated above the schedules. In mGluR1 ON/ON mice, mGluR1 was continuously expressed. In mGluR1 OFF/ON mice, mGluR1 was not expressed in the first conditioning (days 1–7) but was restored in the second conditioning (days 57–61). In mGluR1 OFF/OFF mice, mGluR1 was not expressed during the entire experimental period. *p < 0.05, **p < 0.01, ***p < 0.001 (ON/ON vs. OFF/ON). †p < 0.05, ††p < 0.01, †††p < 0.001 (OFF/ON vs. OFF/OFF). (D) Averaged EMG amplitudes on days 7, 57, and 61. All EMG amplitudes obtained in one session (100 trials) were summed, representing the overall response pattern. (E) The intraday CR% for three groups of mGluR1 cKO mice on days 7 and 57. On day 57 the CR% for mGluR1 OFF/ON mice was as low as that for mGluR1 OFF/OFF mice in all blocks. (F) Expression of mGluR1 in mGluR1 OFF/ON mice. Coronal sections from mGluR1 cKO mice at different time points after Dox withdrawal were stained with antibody against mGluR1. (G) Immunoblotting of cerebellar proteins from mGluR1 cKO mice30 (OFF/ON and ON/ON) with anti-mGluR1 and anti-β-actin antibodies. Proteins from a wild-type mouse (WT), a transgenic mouse harboring L7-mGluR1a transgene (rescue)26 and a global mGluR1 KO mouse (KO)16 were also applied. The blots cropped from different parts of a same gel were separately shown with a white space. All lanes contain 10 µg of protein. Scale bar: 1 mm. Data are represented as mean ± SEM.

