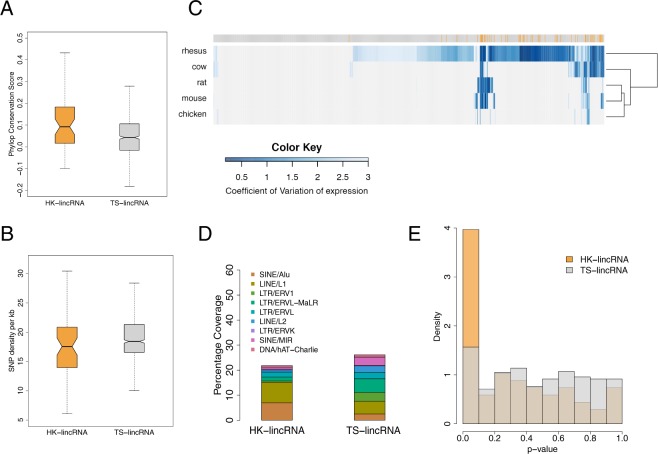
Figure 2.
Characterisation of HK-lincRNA and TS-lincRNAs (A) Mean PhyloP24 conservation scores across exonic nucleotides only, for each lincRNA transcript. (B) SNP density (total number of mutations/total length of the exonic region) in HK-lincRNAs and TS-lincRNAs. Mutation data were obtained from dbSNP (v137)25. (C) Variability of HK-lincRNA and TS-lincRNA homologues. Homologues to human HK- and TS-lincRNAs were identified using nucleotide-BLAST26, and expression levels calculated across nine different tissues in five vertebrate species60. Heatmap represents an unsupervised clustering of CV values for each lincRNA (columns: orange: HK-lincRNAs; grey: TS-lincRNAs) in each species (rows). (D) Annotations of 11 major repeat elements were obtained from Repbase74 database to calculate coverage of repeat elements in exonic regions of lincRNA transcripts. (E) Minimum free energy (MFE) for each lincRNA was calculated using Randfold29 as an indicator of secondary structure stability. Histogram represents distribution of likelihood that each HK-linRNA or TS-lincRNA is more stable than expected by chance. p-values were estimated by comparing to a null distribution generated by permuting the sequences (n = 1000), whilst preserving dinucleotide compositions.

