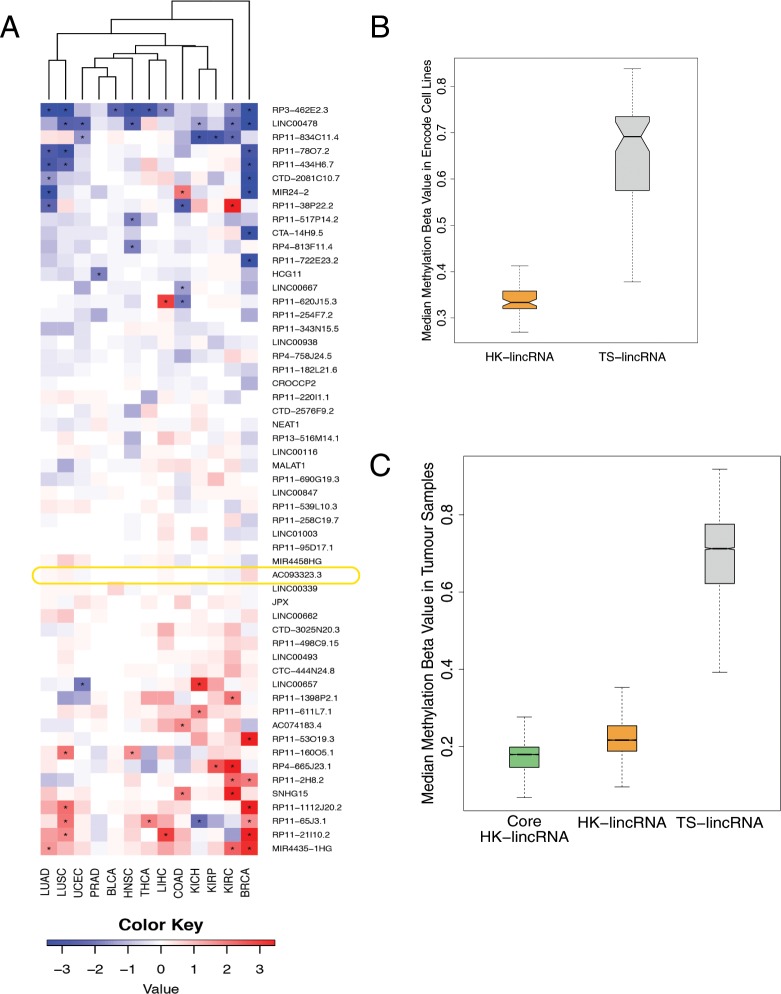
Figure 3.
Detection of essential HK-lincRNAs in cancer (A) Heatmap showing fold changes of HK-lincRNA expression levels in tumour samples, relative to matched normal samples. Data derived from 13 tumour types from The Cancer Genome Atlas (TCGA)32. (B) Methylation levels for candidate HK-lincRNAs and TS-lincRNAs. Methylation β values were obtained for 63 Encode cell lines. The median methylation β value per sample was calculated for each group of genes separately. (C) Methylation levels for ‘core’ HK-lincRNAs, all candidate HK-lincRNAs and TS-lincRNAs. Methylation β values were obtained for 9,269 TCGA tumour samples. The median methylation β value per sample was calculated for each group of genes separately.

