Figure 5.
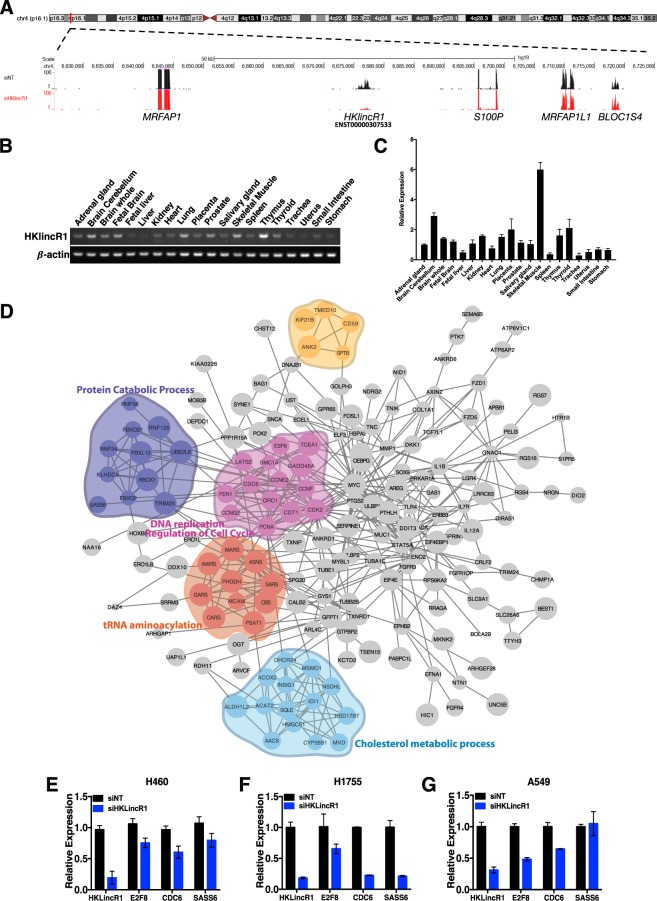
Functional characterisation of HKlincR1 (AC093323.3) (A) Genomic location of HKlincR1. Representative image of H460 RNA-seq track encompassing 50 kb up and downstream of HKlincR1 was plotted using the UCSC genome browser. Non-targeting control track (siNT) was shown in black and siHKlincR1 track was shown in red. (B) RT-PCR and qRT-PCR (C) of HKlincR1 transcript levels across 20 different normal human tissue types. β-actin was used as a positive control. Cropped gel images for HKlincR1 and β-actin were shown in (A). Full length gels are presented in Supplementary Fig. S4C. (D) Protein-protein interaction network of differentially expressed genes following HKlincR1 knockdown. Significant functional modules were identified using ClusterONE72 in Cytoscape71 (p-value < 0.01; Minimum cluster size >4). Biological processes significantly enriched in each cluster were identified using BiNGO73 in Cytoscape (Adjusted p-value < 0.05). (E–G) qRT-PCR analysis of HKlincR1-dependent genes relative to β-actin following HKlincR1 knockdown in H460, H1755 and A549 lung cancer cells. Non-targeting (NT) siRNA was used as a control.

