Figure 6.
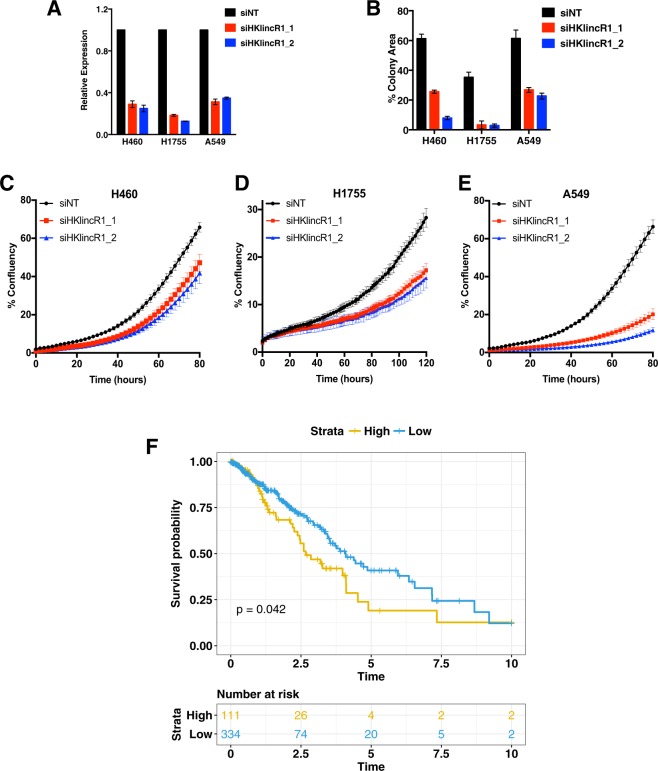
Loss of HKlincR1 leads to reduced E2F8 levels and altered cell cycle in H460 (A) qRT-PCR analysis of HKlincR1 expression relative to β-actin following HKlincR1 knockdown in H460, H1755 and A549 using two independent siRNAs. Non-targeting (NT) siRNA was used as a control. (B) Cell viability measured by crystal violet assay following HKlincR1 knockdown using two different siRNAs vs siNT control, in H460, H1755 and A549. (C–E) Incucyte proliferation assays for H460, H1755 and A549 lung cancer cells. (F) Kaplan-Meier plot of overall survival in TCGA LUAD38 cohort (N = 464) stratified by HKlincR1 expression levels, partitioned on the 75th percentile. Blue: upper quartile. Orange: lower 3 quartiles. Kaplan-Meier plot was generated using survival65 and survminer packages (based on ggplot2) in R.

