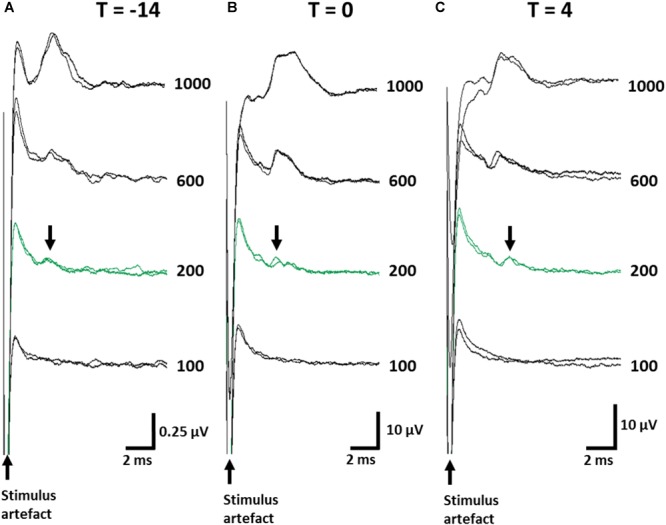
FIGURE 3.

Electrically-evoked C-fiber responses from the abdominal vagus nerve were recorded over the implantation period. Representative ECAPs from one animal are shown when taken immediately following implantation surgery (A, T = -14), prior to the injection of TNBS (B, T = 0) and at the conclusion of the experiment (C, T = 4). Note, the amplitude of the neural response recorded immediately post-implantation (T = -14) were consistently smaller than those at later time points green traces indicate the neural threshold (200 μA) and arrows indicate the elecrically evoked C-fiber response (Latency range: 5.3–5.6 ms). Current amplitude (in μA) is indicated to the right of each set of ECAPs.
