
FIGURE 1.
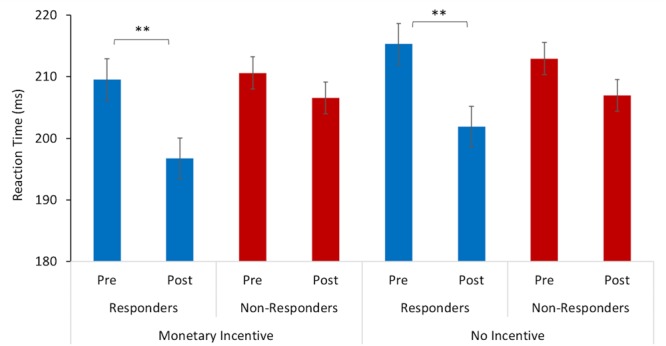
Reaction time to target stimulus as a function of incentive cue (monetary incentive, no-incentive). Changes in mean reaction time (ms) from baseline (pre-) to post-intervention for responders are represented with blue bars and for non-responders with red bars. The error bars represent standard errors. Statistically significant differences are marked with ∗∗ (p < 0.005).