
FIGURE 4.
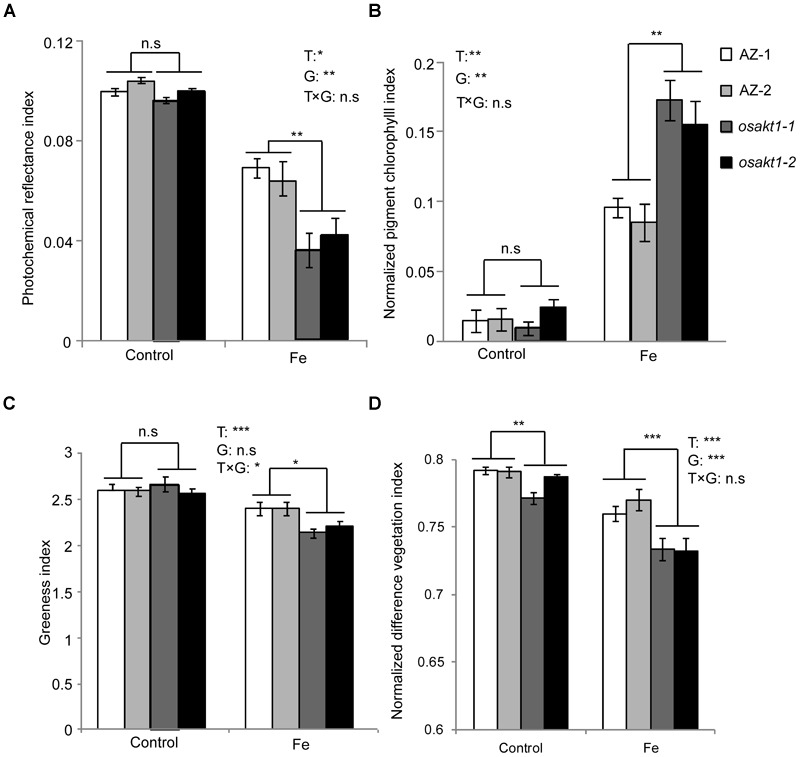
Leaf spectral reflectance indices of OsAKT1 mutant lines. (A) Photochemical reflectance index, (B) normalized pigment chlorophyll index, (C) greenness index, and (D) normalized difference vegetation index. Vertical bars represent mean values ± standard errors (N = 6). T: treatment; G: genotype; T × G: treatment by genotype interaction; ∗P < 0.05; ∗∗P < 0.01; ∗∗∗P < 0.001; n.s: not significant; AZ: azygos line.