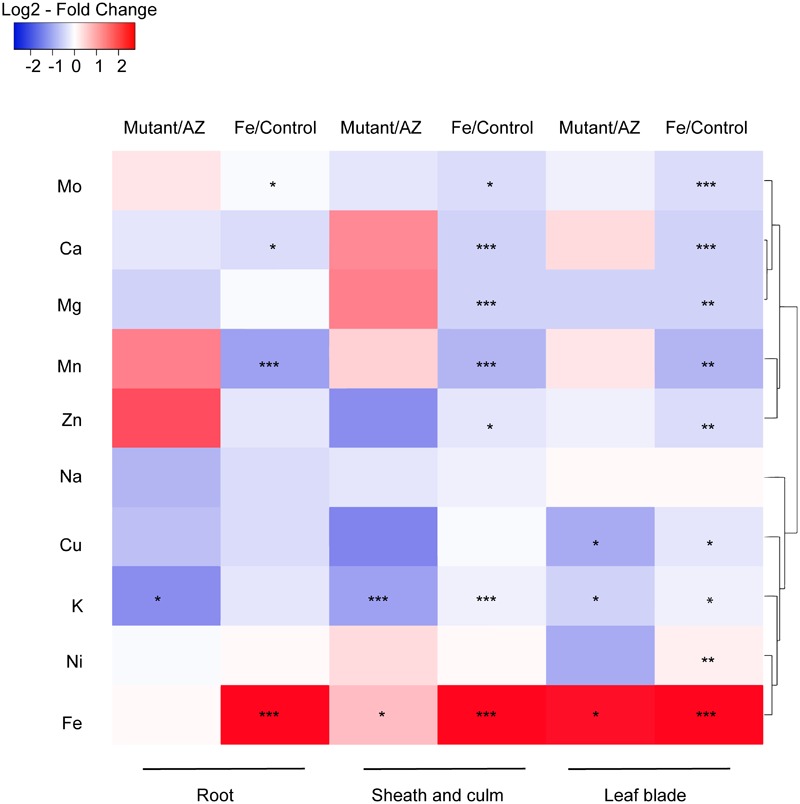
FIGURE 7.

Ionomic profiling of OsAKT1 lines exposed to Fe toxicity (17.9 mM Fe2+ for 5 days). Heatmap was generated using the fold-change value (Log2 transformed) of ions concentrations in various tissues. Blue color indicates the lower element concentration in Fe treatment than control or mutants than azygos lines while red color indicates the opposite results. Only significant differences between treatments or genotypes were shown with asterisks. Hierarchical clustering for the variation patterns of different elements was conducted using the average linkage with the Pearson’s test. AZ: azygos lines; ∗ P < 0.05; ∗∗ P < 0.01; ∗∗∗ P < 0.001.
