
FIGURE 8.
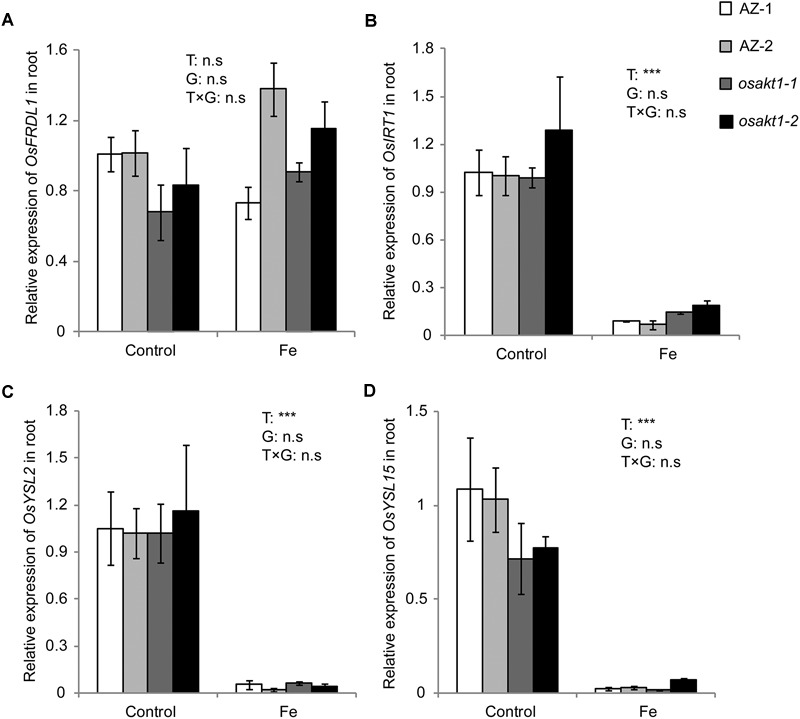
Expression of Fe-transport genes in roots of OsAKT1 lines exposed to Fe toxicity (17.9 mM Fe2+ for 5 days). (A) OsFRDL1, (B) OsIRT1, (C) OsYSL2, and (D) OsYSL15 expression in the root were analyzed with quantitative RT-PCR. Vertical bars represent mean values ± standard errors (N = 3). Sequences of the primers used in the test were listed in Supplementary Table S1. T: treatment; G: genotype; T × G: treatment by genotype interaction; ∗∗∗ P < 0.001, n.s: not significant; AZ: azygos lines.