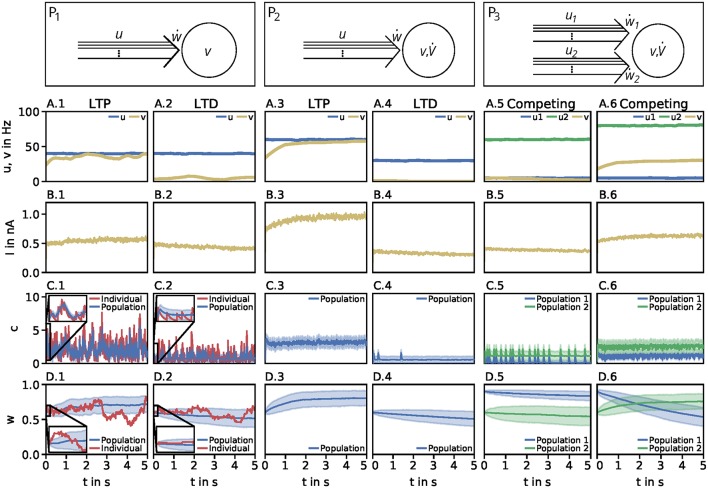
Figure 1.
Dynamics of the detailed model of calcium-based synaptic plasticity for three different neuronal setups P1, P2, and P3. The different setups are shown schematically in the first row. The following rows show (second row; A) the average firing rates, (third row; B) the postsynaptic input current, (fourth row; C) the calcium concentration of an individual synapse using the LC-model (red) and population average (blue) with standard deviation (blue shading), and (fifth row; D) the synaptic weight of an individual synapse (red) and population average (blue) with standard deviation (blue shading). Columns 1 and 2: Dynamics of the P1-setup for initial synaptic strengths of w(t0) = 0.6 and pre- and postsynaptic spike-firing of u = v = 40Hz (column 1; LTP) and u = 40Hz and v = 5Hz (column 2; LTD). Columns 3 and 4: Same as in columns 1 and 2 for the P2-setup with presynaptic spike-firing of u = 60Hz (column 3; LTP) and u = 30Hz (column 4; LTD). Columns 5 and 6: Same as in previous columns for P3-setup of two, competing presynaptic populations 1 (blue) and 2 (green) with initial synaptic weights of w1(t0) = 0.9, w2(t0) = 0.6 and presynaptic spike-firing of u1 = 5Hz, u2 = 60Hz (column 5; no competition) and u1 = 5Hz, u2 = 80Hz (column 6; strong competition). In all cases the populations consist of N = 1, 000 synapses. The continuous presynaptic activities were obtained by averaging all N spiketrains and temporally filtering with an alpha function window of 100ms width. The postsynaptic activities were obtained with an alpha function window of 500ms width and using the MAT-model. The calcium and current traces were filtered with a moving average of 25ms width.

