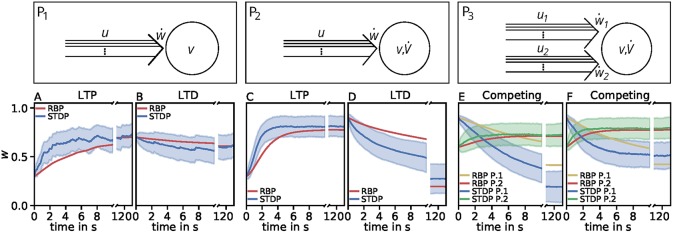
Figure 5.
Comparison of spike-timing dependent synaptic plasticity with rate-based synaptic plasticity according to the third unified estimator (Equation 24) with the additional feature vw2. As in Figure 4, we show the results using the LC-model with the MAT neuron model. (A,B): Dynamics of P1 for global initial synaptic strengths of w = 0.3 and pre- and postsynaptic spike-firing of u = v = 35Hz (A; LTP) and w = 0.7 and u = v = 20Hz (B; LTD). The rate-based plasticity (RBP) is illustrated in red whereas the average spike-timing dependent plasticity (STDP) is illustrated in blue. (C,D) Same as in (A,B) for P2 with global initial synaptic strengths of w = 0.3 and presynaptic spike-firing of u = 65Hz (C; LTP) and w = 0.9 u = 36Hz (D; LTD). The rate-based plasticity (RBP) is illustrated in red whereas the average spike-timing dependent plasticity (STDP) is illustrated in blue. (E,F) Same as in (C,D) for competitive behavior in P3 of two presynaptic populations 1 (blue) and 2 (green) with initial synaptic weights of w1 = 0.9, w2 = 0.6 and presynaptic spike-firing of u1 = 5Hz, u2 = 75Hz (E; no competition) and u1 = 5Hz, u2 = 90Hz (F; strong competition). The rate-based plasticities for populations 1 and 2 are illustrated in yellow and red respectively. The corresponding average spike-timing dependent plasticity is illustrated in blue and green. In all cases the populations consist of N = 1, 000 synapses.

