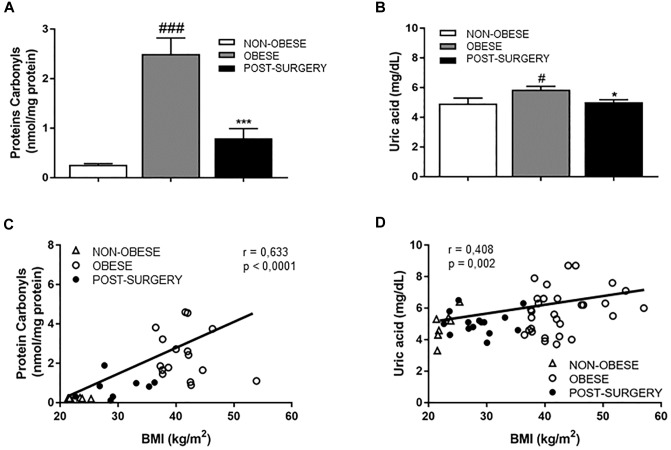
FIGURE 2.
(A,B) Diagram bars shows protein carbonyls (A) and uric acid (UA) concentrations (B) in plasma samples from non-obese (white bar, n = 7), obese (gray bar, n = 31) and post-surgery (black bar, n = 17) patients. (C) Correlation between protein carbonyl concentrations in plasma and BMI. (D) Correlation between plasmatic UA levels and BMI. White triangles correspond to non-obese, white circles correspond to obese and black circles correspond to Post-surgery. Data are expressed as mean ± SEM. #p < 0.05 and ###p < 0.001 compared with the non-obese group. ∗p < 0.05 and ∗∗∗p < 0.001 compared with the obese group.

