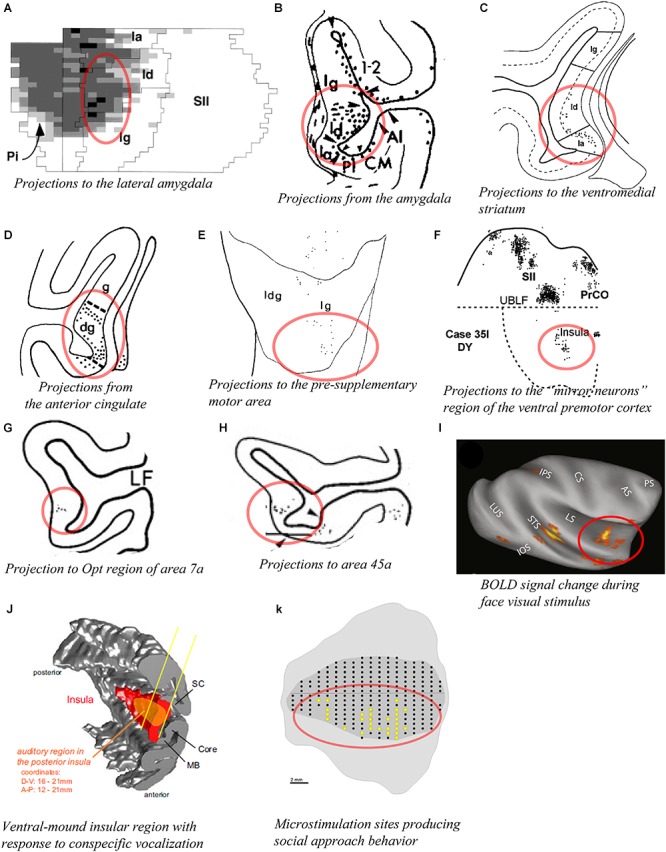
Figure 7.

Connectivity of the mound and ventral dysgranular areas of the macaque insula. In all panels, the regions of labeling in the mound and ventral dysgranular regions of the insula are denoted with a red circle. (A) Flat map plot of fluorescent retrograde labeling in the insula in case M28-92R with an injection of fast blue in the intermediate division of the lateral nucleus. In the flat map, up is rostral and right is dorsal (Stefanacci and Amaral, 2000). (B) Coronal plot of anterograde labeling in the insula in case FCP-2 with an injection of tritiated amino acids in the amygdala (Amaral and Price, 1984). (C) Coronal plot of retrograde labeling in the insula in case MS14 with an injection of WGA-HRP in the ventromedial portion of the striatum (Chikama et al., 1997). (D) Coronal plot of anterograde labeling in the insula in case 2a with an injection of TAA in the anterior cingulate cortex (Mufson and Mesulam, 1982). (E) Flat map plot of fluorescent retrograde labeling in the insula in case 4l with an injection of fast blue in the pre-supplementary motor area. In the flat map, up is dorsal and right is posterior (Luppino et al., 1993). (F) Flat map plot of fluorescent retrograde labeling in the insula in case 35l with an injection of diamidino yellow in the “mirror neuron” sector of the ventral premotor cortex. In the flat map, up is dorsal and right is anterior (Gerbella et al., 2011). (G) Coronal plot of retrograde labeling in the insula in case 23 with an injection of WGA-HRP in the Opt region of area 7a (Rozzi et al., 2006). (H) Coronal plot of retrograde labeling in the insula in case 37l with an injection of fast blue in area 45a (Gerbella et al., 2010). (I) Lateral view of an inflated MRI brain volume showing areas with significant BOLD signal change response to face visual stimuli compared to other categories of non-face visual stimuli (fruit, house, and fractals) in one awake monkey. Similar results were obtained in a second awake monkey (Ku et al., 2011). (J) 3D reconstruction of the cortical mantel showing the localization of an insular region (orange) with a high density of neurons responding predominantly to vocalization stimuli among other non-vocalization auditory stimuli. This region spans from the posterior to mid insula and across the structural mound, visible here with the distinct convexity (mound) within the 3D rendering of the insula (Remedios et al., 2009). (K) Unfolded lateral view of the left insula in one macaque monkey (M1) showing the sites (yellow dots) from which electrical microstimulation evoked “affiliative” behavior (Caruana et al., 2011). In all panels, the structural region corresponding to the mound and ventral dysgranular areas is circled in red. All illustrations in the panels of this figure were adapted with permission from the publishers of the cited references.
