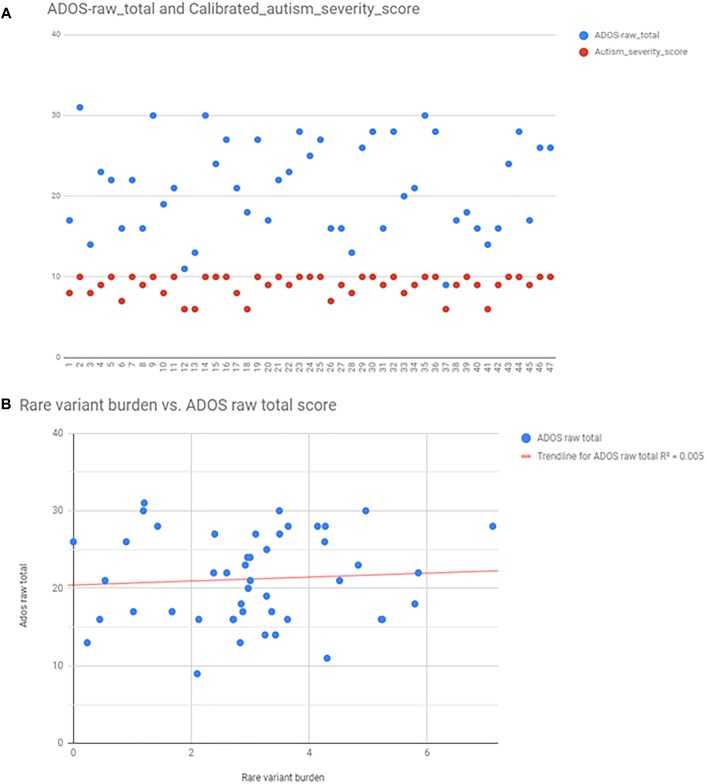
FIGURE 5.
Autism severity scores calculated from ADOS, and the correlation between rare variant burden vs. ADOS scores. Panel (A) shows the scatter plot of ADOS raw total scores (blue points), and the calibrated severity scores (red points). Calculated scores were distributed only between 7 and 10, thus raw total scores were used for linear regression analysis (B).

