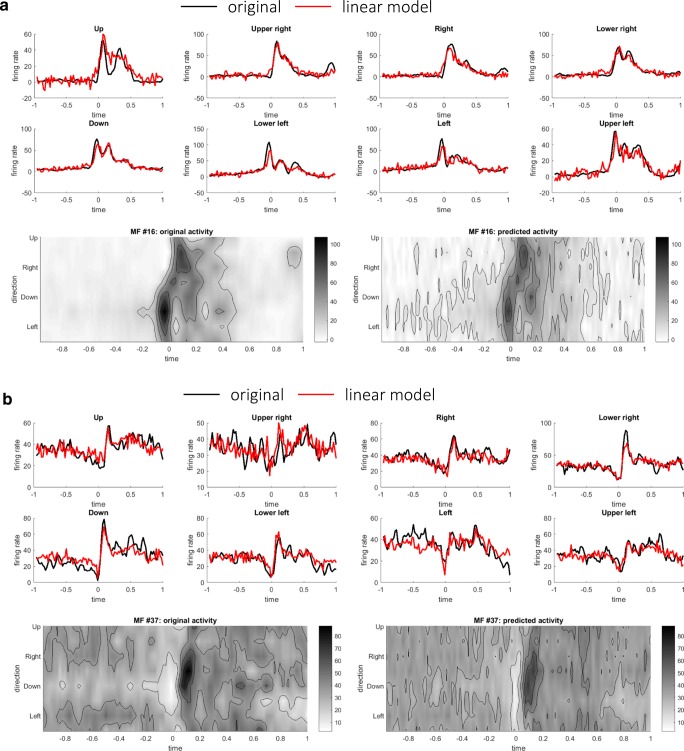
Fig. 7.
Two representative examples of linear predictions of MFs (#16 in a (R2 value 0.91) and #37 in b (R2 value 0.93)) at time t + t1 from DCs at time t. Here t1 was set to 40 ms. In each panel, the original activities and the predicted activities were compared in terms of time series and contour plots

