



Abstract
Research utilizing magnetic resonance imaging (MRI) has been crucial to the understanding of the neuropathological mechanisms behind and clinical identification of Alzheimer’s disease (AD) and mild cognitive impairment (MCI). MRI modalities show patterns of brain damage that discriminate AD from other brain illnesses and brain abnormalities that are associated with risk of conversion to AD from MCI and other behavioural outcomes. This review discusses the application of various MRI techniques to and their clinical usefulness in AD and MCI. MRI modalities covered include structural MRI, diffusion tensor imaging (DTI), arterial spin labelling (ASL), magnetic resonance spectroscopy (MRS), and functional MRI (fMRI). There is much evidence supporting the validity of MRI as a biomarker for these disorders; however, only traditional structural imaging is currently recommended for routine use in clinical settings. Future research is needed to warrant the inclusion for more advanced MRI methodology in forthcoming revisions to diagnostic criteria for AD and MCI.
Keywords: Magnetic resonance imaging, Neuropathology, Alzheimer’s disease, Mild cognitive impairment
Introduction
Alzheimer’s disease (AD) is a neurodegenerative disorder and the most common cause of dementia. Mild cognitive impairment (MCI) is the prodromal form of AD and is characterized by neurocognitive dysfunction, but not to the extent of dementia, and minor difficulties in functional ability. The neuropathological hallmarks of AD include neurofibrillary tangles (NFTs) and beta-amyloid (Aβ) neuritic plaques. The AD brain contains increased levels of hyperphosphorylated tau. In this state, the main functions of normal tau are disrupted and the polymerization of paired helical filaments or NFTs, which are correlated with synaptic loss, occurs. Overproduction of amyloid precursor protein is also characteristic in AD, which results in elevated levels of Aβ42 and neuritic plaque formation. This exerts oxidative and inflammatory stress, which contributes to neuronal damage [1].
Through the in vivo visualization of neuropathology, magnetic resonance imaging (MRI) research has been paramount in the clinical identification of MCI and AD. Diagnostic criteria recommend the consideration of abnormalities on structural MRI [2, 3]. More advanced MR techniques include diffusion tensor imaging (DTI), arterial spin labelling (ASL), magnetic resonance spectroscopy (MRS), and functional magnetic resonance imaging (fMRI), which have not yet been established for routine clinical use. The aim of this review will be to provide an overview of the application of the various MR modalities in AD and MCI. Another clinically useful neuroimaging technology is positron emission tomography (PET) [4]; however, this is beyond the scope of the current work.
Structural imaging
Structural imaging modalities reveal brain atrophy and other static tissue abnormalities (Table 1; Fig. 1). Progression of atrophy follows Braak staging [5] and is first observed in medial temporal lobe (MTL) structures, including the entorhinal cortex (ERC) and hippocampus [6, 7]. Compared to controls, hippocampal volumes for AD patients are reduced by 26–27% and ERC volumes by 38–40% [6]. MCI patients show intermediate levels of MTL atrophy [7]. The presence of diffuse hippocampal atrophy is related to deficits in executive functioning and memory for AD patients [8]. As the disease progresses, atrophy advances to the remainder of the MTL where grey matter (GM) loss occurs in the medial temporal gyrus, parahippocampus, parahippocampal and fusiform gyri, and temporal pole [9]. Nesteruk and colleagues [10] found that MTL atrophy discriminates those who will convert from MCI to AD from non-converters. It also differentiates AD from dementia with Lewy bodies (DLB) and Parkinson’s disease with dementia (PDD), where AD patients show the greatest reductions in hippocampal volume [11, 12].
Table 1.
Research studies examining region-specific patterns of neuropathology in AD and MCI using structural MRI
| Study | Imaging modality | Sample | Main findings |
|---|---|---|---|
| Du et al. [6] | Structural MRI | 20 AD, 25 cognitively normal (CN) | AD patients demonstrated GM loss in the hippocampus and ERC, with a higher atrophy rate in the ERC |
| Pennanen et al. [7] | Structural MRI | 48 AD, 65 MCI, 59 controls | Hippocampal and ERC atrophies were found in AD and MCI patients, with MCI patients showing intermediate levels |
| Li et al. [9] | Structural MRI | 64 AD, 72 controls (14 with AD on follow-up) | Early in the course of AD, the ERC and hippocampus are the primary sites of atrophy. In later stages, other MTL brain structures are affected |
| Cavedo et al. [13] | Structural MRI | 19 AD, 19 controls | GM reductions were demonstrated in the amygdala for AD patients |
| Thomann et al. [14] | Structural MRI | 21 early AD, 21 controls | Atrophy of the olfactory bulb tract was found for AD patients |
| Guo et al. [15] | Structural MRI | 13 AD, 14 controls | GM reductions in parahippocampal gyrus, middle and superior temporal gyrus, insula, parietal lobule, thalamus, hippocampus, and cingulate gyrus were demonstrated for AD patients |
| De Jong et al. [16] | Structural MRI | 69 probable AD, 70 subjects with memory complaints | Compared to subjects with memory complaints, GM loss was shown in the putamen and thalamus for AD patients |
| Kilimann et al. [19] | Structural MRI | 134 AD, 41 MCI, 148 controls | Volumetric reductions in brain areas within the basal forebrain cholinergic system were displayed for AD and MCI patients |
| Duarte et al. [20] | Structural MRI | 14 probable AD, 32 MCI, 14 controls | Frontal, parietal and temporal lobe atrophies were found for AD patients and frontal and temporal GM losses were present for MCI patients |
| Vasavada et al. [22] | Structural MRI | 15 AD, 21 MCI, 27 CN | Brain atrophy was displayed in the hippocampus and the primary olfactory cortex for AD and MCI patients |
| Tabatabaei-Jafari et al. [23] | Structural MRI | 191 AD, 398 MCI, 229 CN | GM reductions in the cerebellum were found for AD patients |
| Lee et al. [24] | Structural MRI | 50 AD, 50 controls | Volumetric reductions in the brainstem were displayed in AD patients |
| Capizzano et al. [27] | Structural MRI | 81 probable AD, 19 controls | A high degree of WMHs was found in AD patients: 70% in the frontal lobe, 22% in the parietal lobe, 3.5% in the temporal lobe, and 1% in the occipital lobe |
Fig. 1.
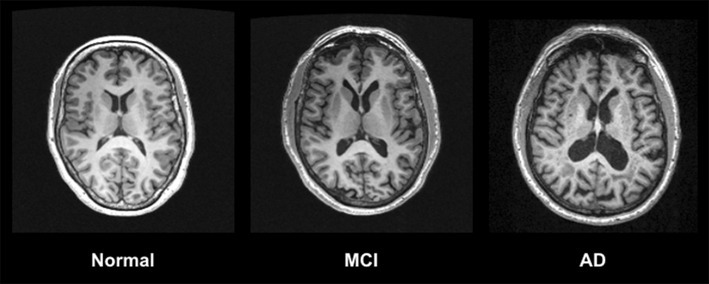
T1-weighted MRI imaging using an MPRAGE (Magnetisation Prepared Rapid Gradient Echo) sequence shows decreased GM volume in an AD patient compared to a healthy control and intermediate GM decline in a patient with MCI
Additional limbic structures including the amygdala, olfactory bulb tract, cingulate gyrus, and thalamus are impacted in AD [13–16]. GM loss in these regions is associated with cognitive dysfunction and neuropsychiatric symptomatology [17, 18]. As the disease progresses, atrophy spreads to cortical regions. Frontal, parietal, and temporal brain areas experience volumetric reductions, and so do the putamen and basal forebrain cholinergic system [15, 16, 19, 20]. Cholinergic abnormalities in AD have been further highlighted through the use of molecular imaging technologies [21]. Atrophy is also found in the primary olfactory cortex [22], in addition to lower-level brain areas including the cerebellum and brainstem [23, 24]. MCI is notable for frontal and temporal GM loss, and atrophy in the primary olfactory cortex and some basal forebrain cholinergic system structures [19, 20, 22]. No volumetric differences were found between AD patients with and without hypertension [25].
Structural MRI scans can also display white matter hyperintensities (WMHs), which indicate demyelination and axonal loss [26] (Table 1; Fig. 2). Compared to controls, patients with AD demonstrate greater WMHs with the majority in frontal lobe [27]. For patients along the AD spectrum, WMHs correlate with hippocampal atrophy [28], in addition to neuropsychological impairment and psychiatric disturbances [29, 30]. Considering differential diagnoses, patients with vascular dementia (VaD) have higher volumes of WMHs than in AD [31]. Periventricular WMHs are predictive of progression from MCI to AD, with an increase of one point in WMH rating associated with a 59% increased risk of phenoconversion [32].
Fig. 2.

T2-weighted MRI imaging using a FLAIR (Fluid Attenuated Inversion Recovery) sequence shows increased WMHs in an AD patient compared to a healthy control and intermediate levels of WMHs in a patient with MCI
Advanced MR techniques
DTI utilizes the displacement of water molecules to measure white matter tract integrity (Table 2). The primary metrics of DTI include mean diffusivity (MD) or the average rate of water molecule diffusivity and fractional anisotropy (FA) or the variability associated with diffusion [33]. In AD, increased MD is noted in frontal, occipital, parietal, and temporal areas including the hippocampus; however, in MCI, these increases are absent in frontal and occipital regions. In AD, decreased FA is localized to the cingulum, corpus callosum, superior lateral fasciculus and uncinate fasciculus and throughout temporal, occipital and frontal white matter. Patients with MCI display a similar pattern, but with no FA irregularities in occipital and parietal areas [34]. MD increases in the basal forebrain are associated with increased risk of progression from MCI to AD [35], and FA and MD abnormalities are associated with memory and executive dysfunction [36, 37]. Diffusivity metrics also discriminate AD from other dementias where reduced FA is present in frontal areas for frontotemporal dementia (FTD) compared to AD, and increased MD is present in parietal and temporal regions for AD in contrast to DLB [38, 39]. However, DTI technology shows particular sensitivity to motion, which could lead to artifacts that might skew results. Comparatively long scanning times could increase the probability of such errors [40], indicating that this technique may not be particularly well suited for practical clinical use.
Table 2.
Research studies examining region-specific patterns of neuropathology in AD and MCI using advanced MR modalities
| Study | Imaging modality | Sample | Main findings |
|---|---|---|---|
| Sexton et al. [34] | DTI | Meta-analysis of 41 studies | MD increases were found globally in WM in AD and in temporal and parietal WM in MCI. FA decreases were found in temporal, occipital and frontal WM in AD and frontal and temporal WM in MCI |
| Alexopoulos et al. [41] | ASL | 19 AD, 24 MCI, 24 controls | Hypoperfusion was noted in parietal, temporal, and occipital cortex, and the precuneus in MCI and AD patients |
| Mak et al. [42] | ASL | 13 AD, 15 controls | Reductions in CBF were found in the hippocampus and posterior cingulate for patients with AD |
| Dai et al. [43] | ASL | 37 AD, 29 MCI, 38 controls | In MCI, decreases in CBF were found in the posterior cingulate and precuneus and increases in CBF were found in the hippocampus, basal ganglia, and amygdala. In AD decreases in CBF were found in frontal, parietal, temporal, orbitofrontal cortex, and the precuneus and increases in CBF were found in the anterior cingulate gyrus. Compared to MCI patients, AD patients showed decreased CBF in temporal, parietal, frontal orbitofrontal cortex and temporal regions such as hippocampus, amygdala, and thalamus |
| Zhu et al. [49] | MRS | 14 AD, 22 CN elderly subjects | Increased mI, mI/Cr and decreased NAA and NAA/Cr ratios were found in parietal areas for patients with AD. NAA/mI ratios were the best classifier for AD |
| Tumati et al. [50] | MRS | Meta-analysis of 29 studies | In the posterior cingulate, Cho/Cr ratios are increased, and NAA/mI ratios are decreased for AD patients. In the hippocampus, mI/Cr ratios are increased for AD patients |
Changes in the neurovasculature system, namely in cerebral blood flow (CBF), can be detected by MR imaging using ASL (Table 2). Notable hypoperfusion is present in the posterior cingulate, precuneus, and, occipital, temporal, parietal cortical areas in AD and MCI, and in frontal and orbitofrontal cortex, and the hippocampus in AD. AD patients demonstrate greater CBF declines in cortex found in temporal, parietal, frontal, and orbitofrontal areas, in addition to the thalamus and middle temporal structures including the hippocampus and amygdala when compared to those with MCI [41–43]. Limited increases in CBF have been shown in the basal ganglia, amygdala, and hippocampus in MCI, and anterior cingulate in AD, which suggests compensatory mechanisms within the brain for cerebrovascular damage [43]. Regarding disease-related outcomes, regional hypoperfusion is associated with progression from MCI to AD, in addition to cognitive and functional deterioration [44]. Measures of perfusion on ASL also discriminate AD from VaD, DLB, and FTD. Differential patterns of CBF reduction were shown in frontal and temporal areas when comparing AD to VaD. Whilst demonstrating the highest degree of hypoperfusion throughout the brain, temporal regions are spared in DLB. In comparison, reduced temporal and frontal CBF is characteristic of AD and FTD, respectively [45, 46]. ASL utilizes magnetically labelled blood water as a tracer and individual differences in blood vessel properties could lead to variable transit times for its delivery. This might result in artificial changes in signal intensity, which a clinician might mistake as a disease-related abnormality in CBF. Another barrier to the employment of ASL in clinical practice is its low signal to noise ratio, which leads to reductions in image quality [47].
MRS assesses brain metabolite levels and its parameters are expressed as concentration or ratios to standardize values [48] (Table 2). When examining region-specific changes in AD, lower N-acetylaspartate (NAA) and NAA/Creatine(Cr) and higher myo-Inositol (mI) and mI/Cr ratios are found in parietal regions. Parietal NAA/mI ratios are also deemed a valid discriminator of AD [49]. In MCI, NAA/mI ratios are lowered and Choline(Cho)/Cr ratios are increased in the posterior cingulate gyrus, whereas mI/Cr ratios are increased in the hippocampus [50]. Clinically, decreased NAA markers are predictive of phenoconversion to dementia and cognitive dysfunction [51, 52]. NAA/Cr and NAA/mI ratios discriminate AD from VaD, and glutamate/Cr ratios differentiate DLB from AD. Metabolic ratios are substantially lower in AD patients compared to VaD, but higher in widespread brain regions relative to DLB [53, 54]. Whilst MRS is able to study molecular processes in the brain non-invasively without exposure to ionizing radiation, this technique is limited by its low sensitivity [55]. Resultant attenuated signal strength makes it difficult to recommend its use by clinicians for diagnostic purposes in AD and MCI.
Functional imaging
Functional MRI generates dynamic representations of brain activity through bold oxygen level-dependent (BOLD) signal, which measures changes in blood flow and volume [56] (Table 3). On memory tasks, patients with AD show no or less activation of hippocampal and other medial temporal structures when compared to controls. Findings of increased brain activity during encoding in parietal and posterior cingulate areas indicate some degree of compensation by the brain in lieu of medial temporal dysfunction [57, 58]. Patients with MCI have demonstrated similar hippocampal deactivation to those with AD during recall [59], but with hyperactivation during encoding phases [60, 61], which might underline mechanistic compensation in prodromal stages. fMRI findings in AD extend to tasks of working memory, visuospatial ability, attention, semantic knowledge, and motor performance [62–66] and in MCI tasks of attention and working memory [62, 64, 67].
Table 3.
Research studies examining region-specific patterns of neuropathology in AD and MCI using functional MRI
| Study | Imaging modality | Sample | Main findings |
|---|---|---|---|
| Small et al. [57] | Task-based fMRI | 4 AD, 12 subjects with isolated memory decline, 4 controls | Reduced activation in regions of the hippocampus was found during a facial recognition task for AD patients. A similar finding was observed for patients with isolated memory decline |
| Sperling et al. [58] | Task-based fMRI | 7 AD, 10 young control subjects, 10 elderly control subjects | Reduced activation in hippocampal areas and increased activation in the parietal regions and the posterior cingulate were found during an encoding task for AD patients |
| Petrella et al. [59] | Task-based fMRI | 13 AD, 34 aMCI, 28 healthy elderly control subjects | Decreased activation was found in middle temporal areas and increased activation was shown in posteromedial cortical regions for AD patients during an encoding task. Patients with MCI showed an intermediate but similar profile |
| Trivedi et al. [60] | Task-based fMRI | 16 aMCI, 23 controls | Reduced activation was noted in frontal areas and increased activation was present in hippocampal areas for MCI patients during an encoding task. During recognition, this region-specific pattern of activation was reversed |
| Parra et al. [61] | Task-based fMRI | 10 AD, 10 MCI, 10 controls | Comparing control subjects and MCI patients, decreased activation was found in the hippocampus and parahippocampus in AD patients during incidental encoding. Increased activation was found for MCI patients relative to control subjects |
| Yetkin et al. [62] | Task-based fMRI | 11 AD, 10 MCI, 9 controls | Increased activation in frontal and temporal regions, fusiform gyrus, and anterior cingulate gyrus was displayed for AD and MCI patients during a working memory task. For selected areas, MCI patients showed greater activation than AD patients |
| Thiyagesh et al. [63] | Task-based fMRI | 12 AD, 13 elderly control subjects | Declines in activation in parietal, parieto-occipital, and premotor cortical areas and increased activation of additional parietal structures was found in AD during an observational visuospatial task |
| Li et al. [64] | Task-based fMRI | 10 AD, 9 MCI, 9 elderly control subjects | Reduced activation was found in prefrontal cortical areas for AD patients and increased activation in these same regions was found for MCI patients during a Stoop colour–word interference task |
| McGeown et al. [65] | Task-based fMRI | 29 AD, 19 controls | No activation in parietal regions and decreased activation in prefrontal areas was found for AD patients during a semantic knowledge task |
| Vidoni et al. [66] | Task-based fMRI | 9 AD, 10 controls | Reduced activation was found in the premotor and supplementary motor regions, and the cerebellum, whilst increased activation was evidenced in the primary motor cortices for AD patients during a motor task |
| Van Dam et al. [67] | Task-based fMRI | 8 aMCI, 8 controls | Increased activation was shown in the tempero-parietal junction, angular gyrus, and precuneus, whereas attenuated activation was seen in prefrontal regions and the anterior cingulate for aMCI patients during an attentional (executive control, alerting and orienting) task |
| Greicius et al. [69] | Resting-State fMRI | 15 AD, 18 controls | Reduced connectivity was shown between medial temporal structures and the posterior cingulate cortex for AD patients |
| Damoiseaux et al. [71] | Resting-State fMRI | Baseline: 21 AD, 18 controls Follow-up: 11 AD, 10 controls |
Compared to control subjects at baseline, declines in connectivity were seen in the posterior DMN and increased activation was found for areas within the ventral and anterior DMN for AD patients. Compared to control subjects at follow-up, decreased connectivity between regions within the anterior, ventral, and posterior DMN in addition to sensorimotor network were shown for AD patients. Compared to control subjects, declines in activation over time were greater for AD patients |
| Yu et al. [72] | Resting-State fMRI | 32 AD, 26 MCI, 58 controls | Increased connectivity between posterior cingulate and non-DMN regions but declines in activation between the posterior cingulate and areas within the DMN were found for AD patients. An opposite pattern of connectivity was shown for MCI patients |
| Das et al. [73] | Resting-State fMRI | 17 aMCI, 31 controls | A greater degree of functional connectivity was shown within regions belonging to the medial temporal lobe, whereas declines in activity were seen between DMN and medial temporal structures for MCI patients |
| Zhou et al. [74] | Resting-State fMRI | 35 AD, 27 MCI, 27 controls | Declines in functional connectivity within a range of regions within the thalamo-cortical network and thalamo-DMN were observed for AD patients. MCI patients showed similar but intermediate deteriorations |
| Li et al. [75] | Resting-State fMRI | 15 AD, 16 healthy elderly control subjects | Declines in functional connectivity within a range of regions within the dorsal attention network but not the ventral attention network were found for AD patients |
| Zheng et al. [76] | Resting-State fMRI | 32 AD, 38 controls | Disturbed functional connectivity was seen in several main networks including the DMN, visual network, and sensorimotor network in AD patients |
Resting-state fMRI provides insight into functional connectivity among structures in intrinsic networks implicated in the AD spectrum (Table 3). One particular network of interest is the default mode network (DMN), where increased neural activity is shown at rest compared to task engagement. Brain structures implicated in the DMN include the posterior cingulate cortex (PCC), ventral anterior cingulate cortex, medial prefrontal cortex, inferior parietal cortex, dorsolateral prefrontal cortex, inferolateral temporal cortex, orbitofrontal cortex, and parahippocampal gyrus [68]. Abnormal coactivation at rest in AD was shown between medial temporal structures such as the hippocampus and entorhinal cortex and the posterior cingulate cortex (PCC) [69]. This evidences the significance of the MTL in the DMN and establishes altered connectivity in the DMN as an indicator for AD. Levels of PCC connectivity to other DMN structures is associated with neuropsychological impairment and declines in PCC-retrosplenial cortex connectivity is associated with lower Aβ levels in the CSF for AD patients [70].
There is a decrease in posterior and an increase in anterior and ventral DMN regions early in AD. 2–4 years later all regions show marked declines in connectivity [71]. This supports the notion that early mechanistic compensation occurs intrinsically within the DMN, but eventually global neurodegeneration occurs. This pattern of DMN dysfunction has been noted in MCI with limited increases in activation between DMN structures, indicative of prodromal compensatory mechanisms [72, 73]. Other large-scale brain networks that show disruption in AD include thalamo-cortical, dorsal attention, visual, and sensorimotor ones [74–76]. Whilst fMRI provides unique insight into pathophysiology, its use in the clinical routine is not supported [77]. This is due to primary limitations including a low signal or contrast to noise ratio and the questionable validity of BOLD signal as a measure of neuronal activity. Unexplained variability in this signal might result from hemodynamic factors that are not controlled for [78].
Conclusions
AD is a devastating illness that leads to cognitive impairment and functional deterioration. MRI modalities have shown substantial utility in identifying biomarkers for AD and MCI pathology. These, in turn, can be used to improve diagnostic accuracy and develop novel molecular-based treatment interventions. Whilst only traditional structural modalities are recommended for diagnosis in clinical practice of MCI and AD, there is a need for further research to overcome methodological limitations of more advanced ones, which provide unique insight into disease-specific patterns of neuropathology. This should hopefully warrant their inclusion in diagnostic criteria for MCI and AD in the future.
Acknowledgements
Data collection and sharing for this project, specifically generation of figures depicting MR images, was funded by the Alzheimer’s Disease Neuroimaging Initiative (ADNI) (National Institutes of Health Grant U01 AG024904) and DOD ADNI (Department of Defense award number W81XWH-12-2-0012). ADNI is funded by the National Institute on Aging, the National Institute of Biomedical Imaging and Bioengineering, and through generous contributions from the following: AbbVie, Alzheimer’s Association; Alzheimer’s Drug Discovery Foundation; Araclon Biotech; BioClinica, Inc.; Biogen; Bristol-Myers Squibb Company; CereSpir, Inc.; Cogstate; Eisai Inc.; Elan Pharmaceuticals, Inc.; Eli Lilly and Company; EuroImmun; F. Hoffmann-La Roche Ltd and its affiliated company Genentech, Inc.; Fujirebio; GE Healthcare; IXICO Ltd.; Janssen Alzheimer Immunotherapy Research & Development, LLC.; Johnson & Johnson Pharmaceutical Research & Development LLC.; Lumosity; Lundbeck; Merck & Co., Inc.; Meso Scale Diagnostics, LLC.; NeuroRx Research; Neurotrack Technologies; Novartis Pharmaceuticals Corporation; Pfizer Inc.; Piramal Imaging; Servier; Takeda Pharmaceutical Company; and Transition Therapeutics. The Canadian Institutes of Health Research is providing funds to support ADNI clinical sites in Canada. Private sector contributions are facilitated by the Foundation for the National Institutes of Health (http://www.fnih.org). The grantee organization is the Northern California Institute for Research and Education, and the study is coordinated by the Alzheimer’s Therapeutic Research Institute at the University of Southern California. ADNI data are disseminated by the Laboratory for Neuro Imaging at the University of Southern California.
Compliance with ethical standards
Conflicts of interest
The authors of this manuscript have no conflicts of interests to disclose relevant to the current review.
Footnotes
Data used in preparation of this article were obtained from the Alzheimer’s Disease Neuroimaging Initiative (ADNI) database (adni.loni.usc.edu). As such, the investigators within the ADNI contributed to the design and implementation of ADNI and/or provided data but did not participate in analysis or writing of this report. A complete listing of ADNI investigators can be found at: http://adni.loni.usc.edu/wp-content/uploads/how_to_apply/ADNI_Acknowledgement_List.pdf.
Contributor Information
Avinash Chandra, Email: avinash.chandra@kcl.ac.uk.
George Dervenoulas, Email: george.dervenoulas@kcl.ac.uk.
Marios Politis, Email: marios.politis@kcl.ac.uk.
References
- 1.Harrington CR. The molecular pathology of Alzheimer’s disease. Neuroimaging Clin N Am. 2012;22:11–22. doi: 10.1016/j.nic.2011.11.003. [DOI] [PubMed] [Google Scholar]
- 2.McKhann GM, Knopman DS, Chertkow H, Hyman BT, Jack CR, Kawas CH, Klunk WE, Koroshetz WJ, Manly JJ, Mayeux R. The diagnosis of dementia due to Alzheimer’s disease: recommendations from the National Institute on Aging-Alzheimer’s Association workgroups on diagnostic guidelines for Alzheimer’s disease. Alzheimer’s Dement. 2011;7:263–269. doi: 10.1016/j.jalz.2011.03.005. [DOI] [PMC free article] [PubMed] [Google Scholar]
- 3.Albert MS, DeKosky ST, Dickson D, Dubois B, Feldman HH, Fox NC, Gamst A, Holtzman DM, Jagust WJ, Petersen RC. The diagnosis of mild cognitive impairment due to Alzheimer’s disease: recommendations from the National Institute on Aging-Alzheimer’s Association workgroups on diagnostic guidelines for Alzheimer’s disease. Alzheimer’s Dement. 2011;7:270–279. doi: 10.1016/j.jalz.2011.03.008. [DOI] [PMC free article] [PubMed] [Google Scholar]
- 4.Politis M, Piccini P. Positron emission tomography imaging in neurological disorders. J Neurol. 2012;259:1769–1780. doi: 10.1007/s00415-012-6428-3. [DOI] [PubMed] [Google Scholar]
- 5.Braak H, Braak E. Neuropathological stageing of Alzheimer-related changes. Acta Neuropathol. 1991;82:239–259. doi: 10.1007/BF00308809. [DOI] [PubMed] [Google Scholar]
- 6.Du A, Schuff N, Kramer J, Ganzer S, Zhu X, Jagust W, Miller B, Reed B, Mungas D, Yaffe K. Higher atrophy rate of entorhinal cortex than hippocampus in AD. Neurology. 2004;62:422–427. doi: 10.1212/01.wnl.0000106462.72282.90. [DOI] [PMC free article] [PubMed] [Google Scholar]
- 7.Pennanen C, Kivipelto M, Tuomainen S, Hartikainen P, Hanninen T, Laakso MP, Hallikainen M, Vanhanen M, Nissinen A, Helkala EL, Vainio P, Vanninen R, Partanen K, Soininen H. Hippocampus and entorhinal cortex in mild cognitive impairment and early AD. Neurobiol Aging. 2004;25:303–310. doi: 10.1016/S0197-4580(03)00084-8. [DOI] [PubMed] [Google Scholar]
- 8.Oosterman JM, Oosterveld S, Rikkert MGO, Claassen JA, Kessels RP. Medial temporal lobe atrophy relates to executive dysfunction in Alzheimer’s disease. Int Psychogeriatr. 2012;24:1474–1482. doi: 10.1017/S1041610212000506. [DOI] [PubMed] [Google Scholar]
- 9.Li X, Coyle D, Maguire L, Watson DR, McGinnity TM. Gray matter concentration and effective connectivity changes in Alzheimer’s disease: a longitudinal structural MRI study. Neuroradiology. 2011;53:733–748. doi: 10.1007/s00234-010-0795-1. [DOI] [PubMed] [Google Scholar]
- 10.Nesteruk M, Nesteruk T, Styczyńska M, Barczak A, Mandecka M, Walecki J, Barcikowska-Kotowicz M. Predicting the conversion of mild cognitive impairment to Alzheimer’s disease based on the volumetric measurements of the selected brain structures in magnetic resonance imaging. Neurol Neurochir Pol. 2015;49:349–353. doi: 10.1016/j.pjnns.2015.09.003. [DOI] [PubMed] [Google Scholar]
- 11.Delli Pizzi S, Franciotti R, Bubbico G, Thomas A, Onofrj M, Bonanni L. Atrophy of hippocampal subfields and adjacent extrahippocampal structures in dementia with Lewy bodies and Alzheimer’s disease. Neurobiol Aging. 2016;40:103–109. doi: 10.1016/j.neurobiolaging.2016.01.010. [DOI] [PubMed] [Google Scholar]
- 12.Tam CW, Burton EJ, McKeith IG, Burn DJ, O’Brien JT. Temporal lobe atrophy on MRI in Parkinson disease with dementia: a comparison with Alzheimer disease and dementia with Lewy bodies. Neurology. 2005;64:861–865. doi: 10.1212/01.WNL.0000153070.82309.D4. [DOI] [PubMed] [Google Scholar]
- 13.Cavedo E, Boccardi M, Ganzola R, Canu E, Beltramello A, Caltagirone C, Thompson P, Frisoni G. Local amygdala structural differences with 3T MRI in patients with Alzheimer disease. Neurology. 2011;76:727–733. doi: 10.1212/WNL.0b013e31820d62d9. [DOI] [PMC free article] [PubMed] [Google Scholar]
- 14.Thomann PA, Dos Santos V, Toro P, Schönknecht P, Essig M, Schröder J. Reduced olfactory bulb and tract volume in early Alzheimer’s disease—a MRI study. Neurobiol Aging. 2009;30:838–841. doi: 10.1016/j.neurobiolaging.2007.08.001. [DOI] [PubMed] [Google Scholar]
- 15.Guo X, Wang Z, Li K, Li Z, Qi Z, Jin Z, Yao L, Chen K. Voxel-based assessment of gray and white matter volumes in Alzheimer’s disease. Neurosci Lett. 2010;468:146–150. doi: 10.1016/j.neulet.2009.10.086. [DOI] [PMC free article] [PubMed] [Google Scholar]
- 16.De Jong L, Van der Hiele K, Veer I, Houwing J, Westendorp R, Bollen E, De Bruin P, Middelkoop H, Van Buchem M, Van Der Grond J. Strongly reduced volumes of putamen and thalamus in Alzheimer’s disease: an MRI study. Brain. 2008;131:3277–3285. doi: 10.1093/brain/awn278. [DOI] [PMC free article] [PubMed] [Google Scholar]
- 17.Tagawa R, Hashimoto H, Matsuda Y, Uchida K, Yoshida A, Higashiyama S, Kawabe J, Toshihiro K, Shiomi S, Mori H. Correlation between right medial temporal lobe atrophy and persecutory delusions in patients with dementia of the Alzheimer’s type demonstrated on VSRAD advance. Osaka City Med J. 2014;60:73–80. [PubMed] [Google Scholar]
- 18.Poulin SP, Dautoff R, Morris JC, Barrett LF, Dickerson BC. Amygdala atrophy is prominent in early Alzheimer’s disease and relates to symptom severity. Psychiatry Res Neuroimaging. 2011;194:7–13. doi: 10.1016/j.pscychresns.2011.06.014. [DOI] [PMC free article] [PubMed] [Google Scholar]
- 19.Kilimann I, Grothe M, Heinsen H, Alho EJL, Grinberg L, Amaro E, Jr, Dos Santos GAB, Da Silva RE, Mitchell AJ, Frisoni GB. Subregional basal forebrain atrophy in Alzheimer’s disease: a multicenter study. J Alzheimers Dis. 2014;40:687–700. doi: 10.3233/JAD-132345. [DOI] [PMC free article] [PubMed] [Google Scholar]
- 20.Duarte A, Hayasaka S, Du A, Schuff N, Jahng G-H, Kramer J, Miller B, Weiner M. Volumetric correlates of memory and executive function in normal elderly, mild cognitive impairment and Alzheimer’s disease. Neurosci Lett. 2006;406:60–65. doi: 10.1016/j.neulet.2006.07.029. [DOI] [PMC free article] [PubMed] [Google Scholar]
- 21.Roy R, Niccolini F, Pagano G, Politis M. Cholinergic imaging in dementia spectrum disorders. Eur J Nucl Med Mol Imaging. 2016;43:1376–1386. doi: 10.1007/s00259-016-3349-x. [DOI] [PMC free article] [PubMed] [Google Scholar]
- 22.Vasavada MM, Wang J, Eslinger PJ, Gill DJ, Sun X, Karunanayaka P, Yang QX. Olfactory cortex degeneration in Alzheimer’s disease and mild cognitive impairment. J Alzheimers Dis. 2015;45:947–958. doi: 10.3233/JAD-141947. [DOI] [PubMed] [Google Scholar]
- 23.Tabatabaei-Jafari H, Walsh E, Shaw ME, Cherbuin N, Initiative AsDN The cerebellum shrinks faster than normal ageing in A lzheimer’s disease but not in mild cognitive impairment. Hum Brain Mapp. 2017;38:3141–3150. doi: 10.1002/hbm.23580. [DOI] [PMC free article] [PubMed] [Google Scholar]
- 24.Lee JH, Ryan J, Andreescu C, Aizenstein H, Lim HK. Brainstem morphological changes in Alzheimer’s disease. Neuroreport. 2015;26:411. doi: 10.1097/WNR.0000000000000362. [DOI] [PMC free article] [PubMed] [Google Scholar]
- 25.Moonga I, Niccolini F, Wilson H, Pagano G, Politis M, Initiative AsDN. Hypertension is associated with worse cognitive function and hippocampal hypometabolism in Alzheimer’s disease. Eur J Neurol. 2017;24:1173–1182. doi: 10.1111/ene.13374. [DOI] [PubMed] [Google Scholar]
- 26.Fazekas F, Kleinert R, Offenbacher H, Schmidt R, Kleinert G, Payer F, Radner H, Lechner H. Pathologic correlates of incidental MRI white matter signal hyperintensities. Neurology. 1993;43:1683–1683. doi: 10.1212/wnl.43.9.1683. [DOI] [PubMed] [Google Scholar]
- 27.Capizzano AA, Acion L, Bekinschtein T, Furman M, Gomila H, Martinez A, Mizrahi R, Starkstein S. White matter hyperintensities are significantly associated with cortical atrophy in Alzheimer’s disease. J Neurol Neurosurg Psychiatry. 2004;75:822–827. doi: 10.1136/jnnp.2003.019273. [DOI] [PMC free article] [PubMed] [Google Scholar]
- 28.de Leeuw FE, Barkhof F, Scheltens P. White matter lesions and hippocampal atrophy in Alzheimer’s disease. Neurology. 2004;62:310–312. doi: 10.1212/01.wnl.0000103289.03648.ad. [DOI] [PubMed] [Google Scholar]
- 29.Debette S, Bombois S, Bruandet A, Delbeuck X, Lepoittevin S, Delmaire C, Leys D, Pasquier F. Subcortical hyperintensities are associated with cognitive decline in patients with mild cognitive impairment. Stroke. 2007;38:2924–2930. doi: 10.1161/STROKEAHA.107.488403. [DOI] [PubMed] [Google Scholar]
- 30.Berlow YA, Wells WM, Ellison JM, Sung YH, Renshaw PF, Harper DG. Neuropsychiatric correlates of white matter hyperintensities in Alzheimer’s disease. Int J Geriatr Psychiatry. 2010;25:780–788. doi: 10.1002/gps.2418. [DOI] [PMC free article] [PubMed] [Google Scholar]
- 31.Altamura C, Scrascia F, Quattrocchi CC, Errante Y, Gangemi E, Curcio G, Ursini F, Silvestrini M, Maggio P, Beomonte Zobel B. Regional MRI diffusion, white-matter hyperintensities, and cognitive function in Alzheimer’s disease and vascular dementia. J Clin Neurol. 2016;12:201–208. doi: 10.3988/jcn.2016.12.2.201. [DOI] [PMC free article] [PubMed] [Google Scholar]
- 32.van Straaten EC, Harvey D, Scheltens P, Barkhof F, Petersen RC, Thal LJ, Jack CR, DeCarli C. Periventricular white matter hyperintensities increase the likelihood of progression from amnestic mild cognitive impairment to dementia. J Neurol. 2008;255:1302. doi: 10.1007/s00415-008-0874-y. [DOI] [PMC free article] [PubMed] [Google Scholar]
- 33.Madden DJ, Bennett IJ, Burzynska A, Potter GG, Chen N-k, Song AW. Diffusion tensor imaging of cerebral white matter integrity in cognitive aging. Biochim Biophys Acta Mol Basis Dis. 2012;1822:386–400. doi: 10.1016/j.bbadis.2011.08.003. [DOI] [PMC free article] [PubMed] [Google Scholar]
- 34.Sexton CE, Kalu UG, Filippini N, Mackay CE, Ebmeier KP. A meta-analysis of diffusion tensor imaging in mild cognitive impairment and Alzheimer’s disease. Neurobiol Aging. 2011;32:2322. doi: 10.1016/j.neurobiolaging.2010.05.019. [DOI] [PubMed] [Google Scholar]
- 35.Brüggen K, Dyrba M, Barkhof F, Hausner L, Filippi M, Nestor PJ, Hauenstein K, Klöppel S, Grothe MJ, Kasper E. Basal forebrain and hippocampus as predictors of conversion to Alzheimer’s disease in patients with mild cognitive impairment—a multicenter DTI and volumetry study. J Alzheimers Dis. 2015;48:197–204. doi: 10.3233/JAD-150063. [DOI] [PubMed] [Google Scholar]
- 36.Sjöbeck M, Elfgren C, Larsson E-M, Brockstedt S, Lätt J, Englund E, Passant U. Alzheimer’s disease (AD) and executive dysfunction. A case-control study on the significance of frontal white matter changes detected by diffusion tensor imaging (DTI) Arch Gerontol Geriatr. 2010;50:260–266. doi: 10.1016/j.archger.2009.03.014. [DOI] [PubMed] [Google Scholar]
- 37.Hirni DI, Kivisaari SL, Monsch AU, Taylor KI. Distinct neuroanatomical bases of episodic and semantic memory performance in Alzheimer’s disease. Neuropsychologia. 2013;51:930–937. doi: 10.1016/j.neuropsychologia.2013.01.013. [DOI] [PubMed] [Google Scholar]
- 38.Zhang Y, Schuff N, Du A-T, Rosen HJ, Kramer JH, Gorno-Tempini ML, Miller BL, Weiner MW. White matter damage in frontotemporal dementia and Alzheimer’s disease measured by diffusion MRI. Brain. 2009;132:2579–2592. doi: 10.1093/brain/awp071. [DOI] [PMC free article] [PubMed] [Google Scholar]
- 39.Firbank MJ, Watson R, Mak E, Aribisala B, Barber R, Colloby SJ, He J, Blamire AM, O’Brien JT. Longitudinal diffusion tensor imaging in dementia with Lewy bodies and Alzheimer’s disease. Parkinsonism Relat Disord. 2016;24:76–80. doi: 10.1016/j.parkreldis.2016.01.003. [DOI] [PubMed] [Google Scholar]
- 40.Mori S, Zhang J. Principles of diffusion tensor imaging and its applications to basic neuroscience research. Neuron. 2006;51:527–539. doi: 10.1016/j.neuron.2006.08.012. [DOI] [PubMed] [Google Scholar]
- 41.Alexopoulos P, Sorg C, Förschler A, Grimmer T, Skokou M, Wohlschläger A, Perneczky R, Zimmer C, Kurz A, Preibisch C. Perfusion abnormalities in mild cognitive impairment and mild dementia in Alzheimer’s disease measured by pulsed arterial spin labeling MRI. Eur Arch Psychiatry Clin Neurosci. 2012;262:69–77. doi: 10.1007/s00406-011-0226-2. [DOI] [PubMed] [Google Scholar]
- 42.Mak HK-F, Qian W, Ng KS, Chan Q, Song Y-Q, Chu LW, Yau KK-W. Combination of MRI hippocampal volumetry and arterial spin labeling MR perfusion at 3-Tesla improves the efficacy in discriminating Alzheimer’s disease from cognitively normal elderly adults. J Alzheimers Dis. 2014;41:749–758. doi: 10.3233/JAD-131868. [DOI] [PubMed] [Google Scholar]
- 43.Dai W, Lopez OL, Carmichael OT, Becker JT, Kuller LH, Gach HM. Mild cognitive impairment and alzheimer disease: patterns of altered cerebral blood flow at MR imaging. Radiology. 2009;250:856–866. doi: 10.1148/radiol.2503080751. [DOI] [PMC free article] [PubMed] [Google Scholar]
- 44.Chao LL, Buckley ST, Kornak J, Schuff N, Madison C, Yaffe K, Miller BL, Kramer JH, Weiner MW. ASL perfusion MRI predicts cognitive decline and conversion from MCI to dementia. Alzheimer Dis Assoc Disord. 2010;24:19. doi: 10.1097/WAD.0b013e3181b4f736. [DOI] [PMC free article] [PubMed] [Google Scholar]
- 45.Gao Y-Z, Zhang J-J, Liu H, Wu G-Y, Xiong L, Shu M. Regional cerebral blood flow and cerebrovascular reactivity in Alzheimer’s disease and vascular dementia assessed by arterial spinlabeling magnetic resonance imaging. Curr Neurovasc Res. 2013;10:49–53. doi: 10.2174/156720213804806016. [DOI] [PubMed] [Google Scholar]
- 46.Binnewijzend MA, Kuijer JP, van der Flier WM, Benedictus MR, Möller CM, Pijnenburg YA, Lemstra AW, Prins ND, Wattjes MP, van Berckel BN. Distinct perfusion patterns in Alzheimer’s disease, frontotemporal dementia and dementia with Lewy bodies. Eur Radiol. 2014;24:2326–2333. doi: 10.1007/s00330-014-3172-3. [DOI] [PubMed] [Google Scholar]
- 47.Alsaedi A, Thomas D, Bisdas S, Golay X. Overview and critical appraisal of arterial spin labelling technique in brain perfusion imaging. Contrast Media Mol Imaging. 2018 doi: 10.1155/2018/5360375. [DOI] [PMC free article] [PubMed] [Google Scholar]
- 48.Reiman EM, Jagust WJ. Brain imaging in the study of Alzheimer’s disease. Neuroimage. 2012;61:505–516. doi: 10.1016/j.neuroimage.2011.11.075. [DOI] [PMC free article] [PubMed] [Google Scholar]
- 49.Zhu X, Schuff N, Kornak J, Soher B, Yaffe K, Kramer JH, Ezekiel F, Miller BL, Jagust WJ, Weiner MW. Effects of Alzheimer disease on fronto-parietal brain N-acetyl aspartate and myo-inositol using magnetic resonance spectroscopic imaging. Alzheimer Dis Assoc Disord. 2006;20:77. doi: 10.1097/01.wad.0000213809.12553.fc. [DOI] [PMC free article] [PubMed] [Google Scholar]
- 50.Tumati S, Martens S, Aleman A. Magnetic resonance spectroscopy in mild cognitive impairment: systematic review and meta-analysis. Neurosci Biobehav Rev. 2013;37:2571–2586. doi: 10.1016/j.neubiorev.2013.08.004. [DOI] [PubMed] [Google Scholar]
- 51.Kantarci K. Proton MRS in mild cognitive impairment. J Magn Reson Imaging. 2013;37:770–777. doi: 10.1002/jmri.23800. [DOI] [PMC free article] [PubMed] [Google Scholar]
- 52.Falini A, Bozzali M, Magnani G, Pero G, Gambini A, Benedetti B, Mossini R, Franceschi M, Comi G, Scotti G. A whole brain MR spectroscopy study from patients with Alzheimer’s disease and mild cognitive impairment. Neuroimage. 2005;26:1159–1163. doi: 10.1016/j.neuroimage.2005.03.005. [DOI] [PubMed] [Google Scholar]
- 53.Weiss U, Bacher R, Vonbank H, Kemmler G, Lingg A, Marksteiner J. Cognitive impairment: assessment with brain magnetic resonance imaging and proton magnetic resonance spectroscopy. J Clin Psychiatry. 2003;64:235–242. doi: 10.4088/jcp.v64n0303. [DOI] [PubMed] [Google Scholar]
- 54.Su L, Blamire A, Watson R, He J, Hayes L, O’brien J. Whole-brain patterns of 1 H-magnetic resonance spectroscopy imaging in Alzheimer’s disease and dementia with Lewy bodies. Transl Psychiatry. 2016;6:e877. doi: 10.1038/tp.2016.140. [DOI] [PMC free article] [PubMed] [Google Scholar]
- 55.Chatham JC, Blackband SJ. Nuclear magnetic resonance spectroscopy and imaging in animal research. IlAR J. 2001;42:189–208. doi: 10.1093/ilar.42.3.189. [DOI] [PubMed] [Google Scholar]
- 56.Logothetis NK, Pauls J, Augath M, Trinath T, Oeltermann A. Neurophysiological investigation of the basis of the fMRI signal. Nature. 2001;412:150. doi: 10.1038/35084005. [DOI] [PubMed] [Google Scholar]
- 57.Small SA, Perera GM, DeLaPaz R, Mayeux R, Stern Y. Differential regional dysfunction of the hippocampal formation among elderly with memory decline and Alzheimer’s disease. Ann Neurol. 1999;45:466–472. doi: 10.1002/1531-8249(199904)45:4<466::aid-ana8>3.0.co;2-q. [DOI] [PubMed] [Google Scholar]
- 58.Sperling RA, Bates J, Chua E, Cocchiarella A, Rentz D, Rosen B, Schacter D, Albert M. fMRI studies of associative encoding in young and elderly controls and mild Alzheimer’s disease. J Neurol Neurosurg Psychiatry. 2003;74:44–50. doi: 10.1136/jnnp.74.1.44. [DOI] [PMC free article] [PubMed] [Google Scholar]
- 59.Petrella JR, Wang L, Krishnan S, Slavin MJ, Prince SE, Tran T-TT, Doraiswamy PM. Cortical deactivation in mild cognitive impairment: high-field-strength functional MR imaging. Radiology. 2007;245:224–235. doi: 10.1148/radiol.2451061847. [DOI] [PubMed] [Google Scholar]
- 60.Trivedi MA, Murphy CM, Goetz C, Shah RC, Gabrieli JD, Whitfield-Gabrieli S, Turner DA, Stebbins GT. fMRI activation changes during successful episodic memory encoding and recognition in amnestic mild cognitive impairment relative to cognitively healthy older adults. Dement Geriatr Cogn Disord. 2008;26:123–137. doi: 10.1159/000148190. [DOI] [PMC free article] [PubMed] [Google Scholar]
- 61.Parra MA, Pattan V, Wong D, Beaglehole A, Lonie J, Wan HI, Honey G, Hall J, Whalley HC, Lawrie SM. Medial temporal lobe function during emotional memory in early Alzheimer’s disease, mild cognitive impairment and healthy ageing: an fMRI study. BMC Psychiatry. 2013;13:76. doi: 10.1186/1471-244X-13-76. [DOI] [PMC free article] [PubMed] [Google Scholar]
- 62.Yetkin FZ, Rosenberg RN, Weiner MF, Purdy PD, Cullum CM. FMRI of working memory in patients with mild cognitive impairment and probable Alzheimer’s disease. Eur Radiol. 2006;16:193–206. doi: 10.1007/s00330-005-2794-x. [DOI] [PubMed] [Google Scholar]
- 63.Thiyagesh SN, Farrow TF, Parks RW, Accosta-Mesa H, Young C, Wilkinson ID, Hunter MD, Woodruff PW. The neural basis of visuospatial perception in Alzheimer’s disease and healthy elderly comparison subjects: an fMRI study. Psychiatry Res Neuroimaging. 2009;172:109–116. doi: 10.1016/j.pscychresns.2008.11.002. [DOI] [PubMed] [Google Scholar]
- 64.Li C, Zheng J, Wang J, Gui L, Li C. An fMRI stroop task study of prefrontal cortical function in normal aging, mild cognitive impairment, and Alzheimer’s disease. Curr Alzheimer Res. 2009;6:525–530. doi: 10.2174/156720509790147142. [DOI] [PubMed] [Google Scholar]
- 65.McGeown WJ, Shanks MF, Forbes-McKay KE, Venneri A. Patterns of brain activity during a semantic task differentiate normal aging from early Alzheimer’s disease. Psychiatry Res Neuroimaging. 2009;173:218–227. doi: 10.1016/j.pscychresns.2008.10.005. [DOI] [PubMed] [Google Scholar]
- 66.Vidoni ED, Thomas GP, Honea RA, Loskutova N, Burns JM. Evidence of altered corticomotor system connectivity in early-stage Alzheimer’s disease. J Neurol Phys Ther. 2012;36:8. doi: 10.1097/NPT.0b013e3182462ea6. [DOI] [PMC free article] [PubMed] [Google Scholar]
- 67.Van Dam NT, Sano M, Mitsis EM, Grossman HT, Gu X, Park Y, Hof PR, Fan J. Functional neural correlates of attentional deficits in amnestic mild cognitive impairment. PLoS One. 2013;8:e54035. doi: 10.1371/journal.pone.0054035. [DOI] [PMC free article] [PubMed] [Google Scholar]
- 68.Greicius MD, Krasnow B, Reiss AL, Menon V. Functional connectivity in the resting brain: a network analysis of the default mode hypothesis. Proc Natl Acad Sci. 2003;100:253–258. doi: 10.1073/pnas.0135058100. [DOI] [PMC free article] [PubMed] [Google Scholar]
- 69.Greicius MD, Srivastava G, Reiss AL, Menon V. Default-mode network activity distinguishes Alzheimer’s disease from healthy aging: evidence from functional MRI. Proc Natl Acad Sci USA. 2004;101:4637–4642. doi: 10.1073/pnas.0308627101. [DOI] [PMC free article] [PubMed] [Google Scholar]
- 70.Celebi O, Uzdogan A, Oguz KK, Has AC, Dolgun A, Cakmakli GY, Akbiyik F, Elibol B, Saka E. Default mode network connectivity is linked to cognitive functioning and CSF Aβ1–42 levels in Alzheimer’s disease. Arch Gerontol Geriatr. 2016;62:125–132. doi: 10.1016/j.archger.2015.09.010. [DOI] [PubMed] [Google Scholar]
- 71.Damoiseaux JS, Prater KE, Miller BL, Greicius MD. Functional connectivity tracks clinical deterioration in Alzheimer’s disease. Neurobiol Aging. 2012;33:828. doi: 10.1016/j.neurobiolaging.2011.06.024. [DOI] [PMC free article] [PubMed] [Google Scholar]
- 72.Yu E, Liao Z, Mao D, Zhang Q, Ji G, Li Y, Ding Z. Directed functional connectivity of posterior cingulate cortex and whole brain in Alzheimer’s disease and mild cognitive impairment. Curr Alzheimer Res. 2017;14:628–635. doi: 10.2174/1567205013666161201201000. [DOI] [PubMed] [Google Scholar]
- 73.Das SR, Pluta J, Mancuso L, Kliot D, Orozco S, Dickerson BC, Yushkevich PA, Wolk DA. Increased functional connectivity within medial temporal lobe in mild cognitive impairment. Hippocampus. 2013;23:1–6. doi: 10.1002/hipo.22051. [DOI] [PMC free article] [PubMed] [Google Scholar]
- 74.Zhou B, Liu Y, Zhang Z, An N, Yao H, Wang P, Wang L, Zhang X, Jiang T. Impaired functional connectivity of the thalamus in Alzheimer’s disease and mild cognitive impairment: a resting-state fMRI study. Curr Alzheimer Res. 2013;10:754–766. doi: 10.2174/15672050113109990146. [DOI] [PubMed] [Google Scholar]
- 75.Li R, Wu X, Fleisher AS, Reiman EM, Chen K, Yao L. Attention-related networks in Alzheimer’s disease: a resting functional MRI study. Hum Brain Mapp. 2012;33:1076–1088. doi: 10.1002/hbm.21269. [DOI] [PMC free article] [PubMed] [Google Scholar]
- 76.Zheng W, Liu X, Song H, Li K, Wang Z. Altered functional connectivity of cognitive-related cerebellar subregions in Alzheimer’s disease. Front Aging Neurosci. 2017;9:143. doi: 10.3389/fnagi.2017.00143. [DOI] [PMC free article] [PubMed] [Google Scholar]
- 77.Rocchi L, Niccolini F, Politis M. Recent imaging advances in neurology. J Neurol. 2015;262:2182–2194. doi: 10.1007/s00415-015-7711-x. [DOI] [PubMed] [Google Scholar]
- 78.Bandettini PA. Neural correlates of thinking. New York: Springer; 2009. Functional MRI limitations and aspirations; pp. 15–38. [Google Scholar]