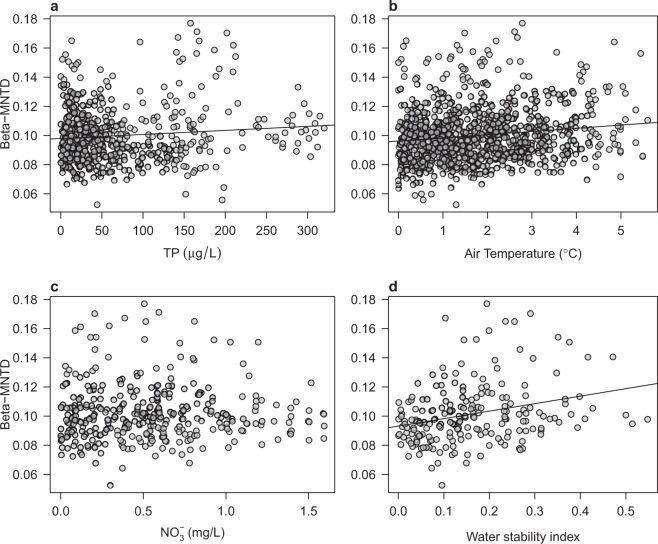
Figure 4.
Cyanobacterial beta-diversity over environmental gradients. Phylogenetic similarity (based on beta-MNTD) between pair of samples are plotted against environmental distances (euclidean) in (a) TP concentrations (µg/L) and (b) NO3− concentrations (mg/L), (c) air temperature (°C), and (d) maximal annual Schmidt Stability Index (SSI). Only significant regressions (p ≤ 0.05) are shown. The number of samples in each analysis depends on the availability of lake monitoring data (details on the time-series of monitoring data are found in16). Samples used in the regression analysis are the non-random communities (i.e., showing significant phylogenetic structure based on SESMNTD deviation from the null model expectation).

