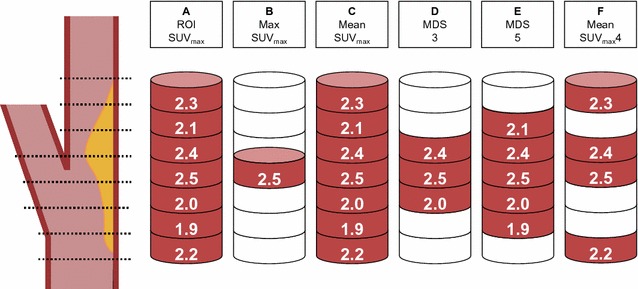
Figure 2.

18F-FDG uptake quantification was based on the SUVmax of all the plaque-containing axial PET slices (A): Max SUVmax = the single highest SUVmax (B), mean SUVmax = the mean of all plaque SUVmax (C), MDS3 = the mean SUVmax of the three contiguous slices centered on the slice with the highest SUVmax (D), MDS5 = the mean SUVmax of the five contiguous slices centered on the slice with the highest SUVmax (E), and mean SUVmax4 = the mean SUVmax of the four slices with highest SUVmax within the plaque(F) (based on a figure by Tawakol et al 32)
