Figure 7.

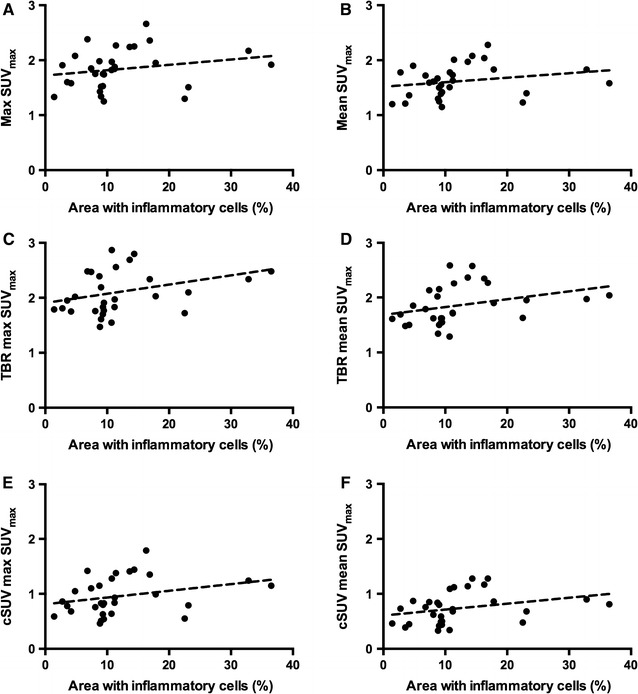
Scatter plots with correlation lines of total area with inflammatory cells versus uncorrected (A, B) and background-corrected (TBR: C, D and cSUV: E, F) max and mean SUVmax

Scatter plots with correlation lines of total area with inflammatory cells versus uncorrected (A, B) and background-corrected (TBR: C, D and cSUV: E, F) max and mean SUVmax