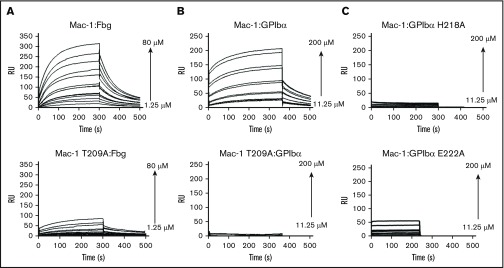
Figure 5.
SPR analysis of Mac-1 I-domain interactions. Plots of SPR sensorgrams measured in RU on the y-axis illustrating wild-type Mac-1 (top) or Mac-1 T209A (bottom) binding to fibrinogen (Fbg; A) and GP1bαN (B), and shown in wild-type Mac-1 I-domain binding to the GP1bαN mutants H218A (C, top) and E222A (C, bottom). RU, response unit.

