Figure 2.
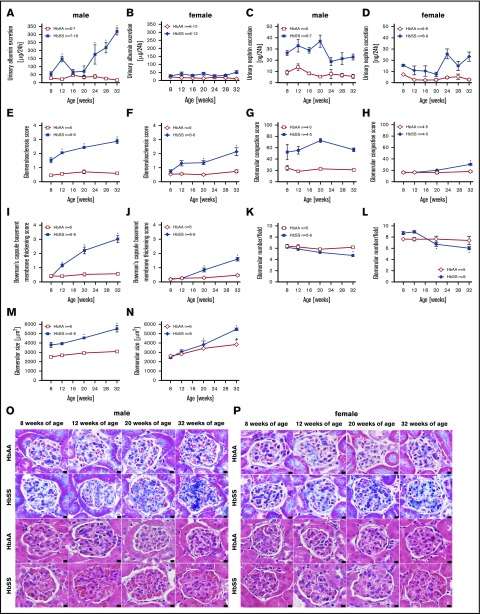
Measures of glomerular injury in male and female HbSS and HbAA mice. Trajectory of urinary albumin excretion in male (A) and female (B) HbAA and HbSS mice. Trajectory of urinary nephrin excretion in male (C) and female (D) HbAA and HbSS mice. Quantification of glomerulosclerosis represented as sclerosis index score in male (E) and female (F) HbAA and HbSS mice. Quantification of glomerular vascular congestion represented as the sum of the glomerular congestion index score in male (G) and female (H) HbAA and HbSS mice. Quantification of the Bowman's capsule basement membrane thickening score in male (I) and female (J) HbAA and HbSS mice. Number of glomeruli per field in male (K) and female (L) HbAA and HbSS mice. Glomerular size represented as mean area of glomeruli from male (M) and female (N) HbAA and HbSS mice. (O) Representative Masson trichrome– and hematoxylin and eosin–stained sections of glomeruli from male HbAA and HbSS mice. Original magnification ×40; scale bar = 50 μm. (P) Representative Masson trichrome– and hematoxylin and eosin—stained sections of glomeruli from female HbAA and HbSS mice. Original magnification ×40; scale bars = 50 μm. Data are mean ± SEM; *P < .05 vs 8-week HbSS mice. Analysis by 1-way ANOVA with repeated measurements with Tukey post hoc analysis. (A) Genotype and age, P < .0001. (B) Genotype, P < .0001; age, P = .9348. (C) Genotype, P < .0001; age, P = .0202. (D) Genotype, P < .0001; age, P = .0279, or 2-way ANOVA with Tukey post hoc test. (E) Interaction, genotype, and age, P < .0001. (F) Interaction, P = .0039; genotype and age, P < .0001. (G) Interaction, P = .3446; genotype, P < .0001; age, P = .2662. (H) Interaction, P = .0003; genotype, P = .0002; age, P < .0001. (I-) Interaction, genotype, and age, P < .0001. (K) Interaction, P = .0571; genotype, P = .0050; age, P = .0038. (L) Interaction, P = .0032; genotype, P = .9450; age, P = .0009. (M) Interaction, P = .0118; genotype and age, P < .0001. (N) Interaction, P = .0005; genotype, P = .0006; age, P = .0001.

