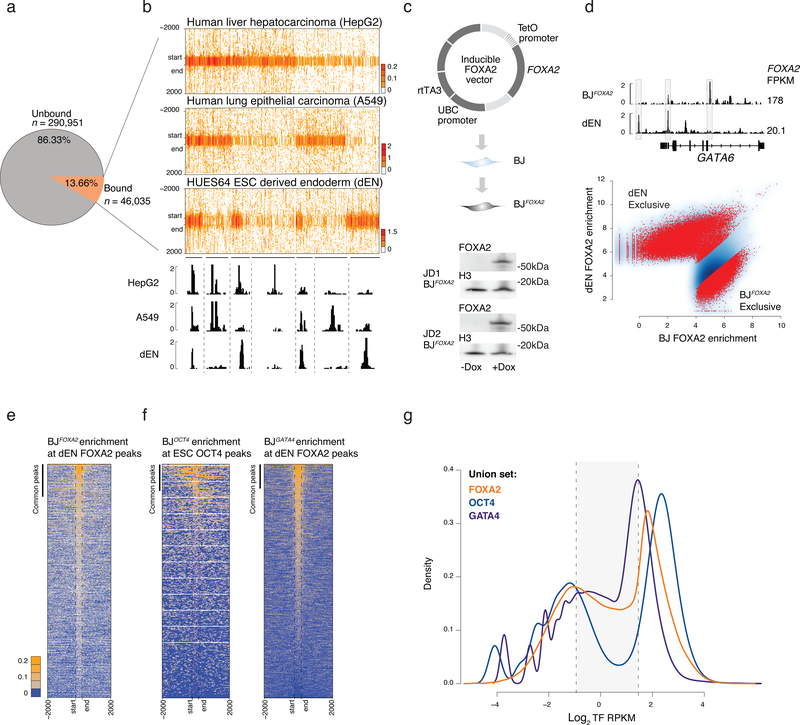
Figure 1 |. Ectopic FOXA2 and GATA4 but not OCT4 display low-level sampling.
a) Pie chart displays the percentage of FOXA motifs (see Supplementary Fig. 1) mapped across the genome that are unbound or bound by FOXA2 at a potentially accessible genomic region in ESC derived endoderm (dEN), HepG2, and A549 cells.
b) Read density heat maps for all IDR called FOXA2 peaks in dEN, A549 and HepG2 cells that overlap a motif instance. Heat maps are clustered by occurrence of binding across the three cell types. IGV tracks highlight shared genomic occupancy across the three cell types (chr18:9,072,728–9,075,158), unique occupancy in HepG2 (chr18:9,202,880–9,225,100), unique in A549 (chr18:9,008,450–9,022,842) shared occupancy in A549 and HepG2 (chr18:8,725,886–8,734,843) shared in HepG2 and dEN (chr4:80,986,601–81,000,201) shared in A549 and dEN chr4:75,017,694–75,029,960 and unique occupancy in dEN (chr4:74,903,404–74,905,306).
c) Schematic of the pTripZ vector used for the generation of a clonal FOXA2 inducible cell line, BJFOXA2. Cropped western blot of FOXA2 and H3 protein levels in two, distinct BJFOXA2 clones (JD1 and JD2).
d) IGV browser shots display differential binding across ectopic BJFOXA2 and dEN (chr18:19,745,852–19,782,939). FOXA2 FPKMs listed on the right. Scatter plot shows output of DiffBind41 differential peak set analysis between dEN and BJFOXA2. Red dots indicate peaks with statistically significant differential enrichment between the two data sets.
e) Read density heat maps of FOXA2 enrichment in BJFOXA2 at dEN FOXA2 regions. Bar indicates peak calls in common between ectopic FOXA2 ChIP-seq data in BJFOXA2 and dEN FOXA2 ChIP-seq. Dashed lines mark the start and end of FOXA2 peaks. Most dEN sites still show low-level enrichment of FOXA2 in BJFOXA2 fibroblasts yet are not called as significantly enriched.
f) Read density heat map of OCT4 signal in the BJs at human ESC OCT4 regions (n=22,477). Bar indicates peak calls in common between ectopic OCT4 ChIP-seq data and ESC OCT4 ChIP-seq (n=1,972). In contrast to FOXA2, very few ESC OCT4 sites show any notable level of OCT4 enrichment in BJOCT4. Read density heat map of GATA4 signal in the BJs at human GATA4 dEN bound genomic regions (n=42,477).
g) Density plot displaying FOXA2, OCT4 and GATA4 log2 RPKM ectopic enrichment in BJs at union sets of ectopic and endogenous sites (FOXA2 – orange, OCT4 – navy, GATA4 - blue). Dashed lines demarcate regions within the background distribution, regions called as sampled sites (shaded) and regions that were called as peaks.

