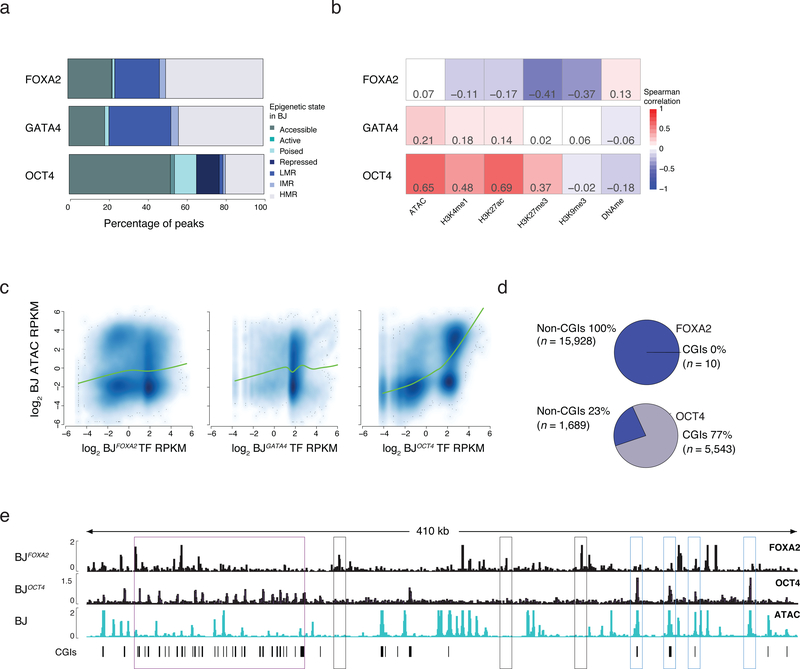
Figure 2 |. Influence of prior epigenetic state on pioneer factor occupancy.
a) Percentage of TF bound regions in BJFOXA2, BJGATA4, BJOCT4 falling into assigned chromatin states. State is defined hierarchically using chromatin state in BJ fibroblasts prior to TF induction. First, ‘accessible’ regions were categorized by the occurrence of ATAC-seq enrichment. Then regions highly enrichment for H3K27ac or H3K4me1 were categorized as ‘active’ and ‘poised’, respectively. Regions enriched for H3K27me3 or H3K9me3 were categorized broadly as ‘repressed’ and finally all remaining regions that were not classified into one of the above classes were grouped by their DNAme levels: highly methylated regions (HMRs > 60% mean methylation), intermediate methylated regions (IMR mean methylation: 20–60%) and lowly methylated regions (LMR: < 20% mean methylation). LMRs are equivalent to a ‘low signal’ state that lacks DNA accessibility as well as enrichment of any assessed histone modifications4.
b) Spearman correlations between TF enrichment and enrichment of epigenetic features displayed as heat map.
c) Scatter plots and lowess fit curves (green line) of FOXA2, OCT4 and GATA4 enrichment (Log2 RPKM) versus ATAC-seq enrichment in BJs prior to factor induction (Log2 RPKM).
d) Pie charts summarize the percentage of FOXA2 and OCT4 targets that overlap with defined pre-existing closed chromatin and fall within annotated CpG islands (CGIs).
e) Representative IGV browser tracks displaying FOXA2 and OCT4 enrichment compared to pre-induced BJ ATAC-seq data (chr5:140,657,329–141,085,891). Purple boxes highlight regions of OCT4 binding in pre-existing closed chromatin that overlap with annotated CGIs. Gray boxes highlight FOXA2 binding at pre-existing closed chromatin while blue boxes highlight OCT4 binding in regions of pre-existing open chromatin.

