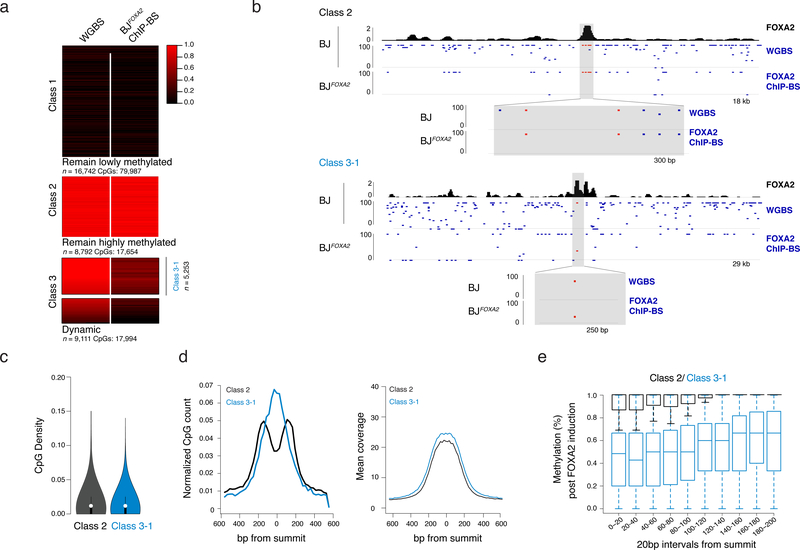
Figure 5 |. Distance dependent loss of DNAme at selective FOXA2 targets.
a) Heat map of CpG methylation levels for matched CpGs comparing BJ WGBS (pre-FOXA2 induction) and post-FOXA2 induction ChIP bisulfite sequencing data. Three main classes of FOXA2 binding are displayed. Gray bar in Class 3 indicates the subset of dynamic regions that have a pre-induction methylation level of greater than 80% (regions n=5253) and are further referred to as Class 3–1.
b) Representative IGV browser tracks showing BJFOXA2 FOXA2 enrichment, CpG methylation pre- FOXA2 induction and FOXA2 ChIP-BS data post induction. Top half is an example of a class 2 region (remain hypermethylated) located at chr12:54,002,592–54,021,127. The bottom shot is an example of a class 3 region (dynamic) located at chr18:32,911,411–32,941,267. Zoomed view displays locations of CpG with respect to peak enrichment summit.
c) Violin plot of CpG density of class 2 and class 3 target sites. CpG density is calculated by the number of CpG dinucleotides across 100bp windows divided by total number of base pairs. Dots represent median values while black lines indicate interquartile range.
d) Composite plots showing normalized CpG count of class 2 and class 3 target sites (left). Class 2 is depleted for CpGs toward the center of the peak while class 3 targets are enriched. Mean sequencing coverage between class 2 and class 3 target sites is equivalent (right).
e) Box plot show the percent methylation of CpGs within 20bp windows from the summit of the peak and extended up to 200bp. Methylation measurements were taken from ChIP-BS data after FOXA2 induction. Class 2 black. Class 3–1 blue. Boxes indicate interquartile range and whiskers show maximum and minimum values. Outliers are removed.

