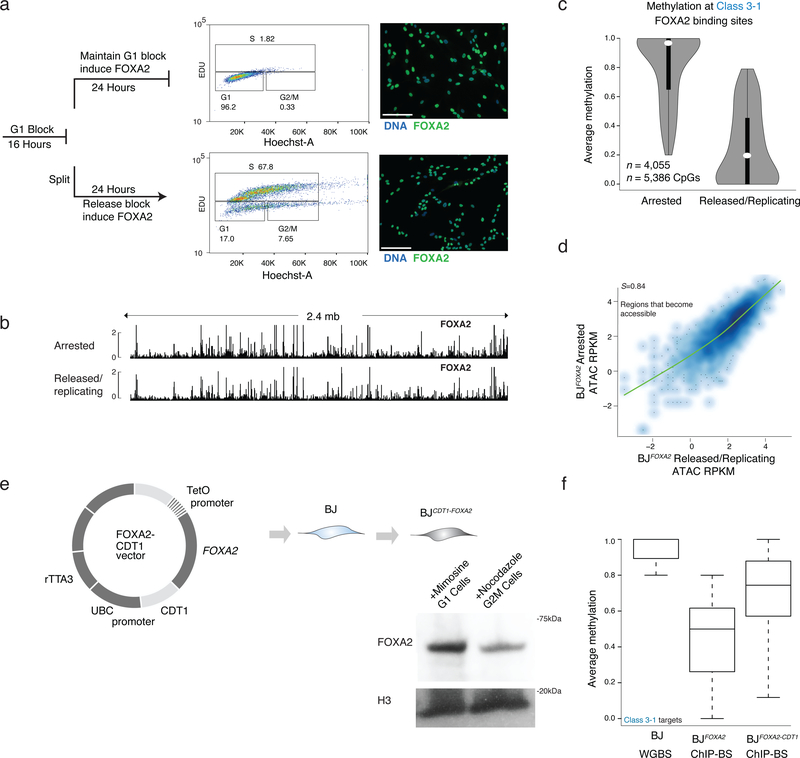
Figure 6 |. Loss of DNA methylation but not binding nor nucleosome remodeling is dependent on DNA replication.
a) Cells were halted before DNA replication by blocking the BJFOXA2 cells from progressing in G1 with mimosine, then either released into normal replicating conditions by cell splitting and washing out the chemical treatment or maintaining them halted by persisted treatment with mimosine. FOXA2 was simultaneously induced in both for 24h. FACS analysis using EdU incorporation (488nm) and Hoechst DNA stain shows that halted cells remain in G1 and cells that are removed from chemical block can proliferate at a normal rate. Both populations of cells express FOXA2 highly as shown by immunostaining on the right. White scale bar is equal to 345nm.
b) Representative IGV browser tracks of a 2.4mb window (chr8:57,156,834–59,597,409) showing FOXA2 ChIP-seq data from cells halted in G1 (top track) and cells that were halted and then released back in to normal cycling conditions (bottom track). FOXA2 binding and accumulation is visually similar in both experiments.
c) Violin plots of the average methylation levels for class 3–1 between cells arrested in G1 and cells in normal replicating conditions. Dynamic regions no longer lose DNAme when cells are arrested in G1. Dots represent median values and bar indicates interquartile range.
d) Scatter plot of ATAC-seq signal post FOXA2 induction at regions that become accessible upon FOXA2 binding in G1 arrested cells compared to cells released back into normal cycling conditions. Spearman correlations show the samples are highly correlated.
e) Schematic representation of FOXA2-CDT1 fusion lentiviral construct generated with corresponding cropped western blot for FOXA2 in BJFOXA2-CDT1 cells treated with Mimosine to enhance proportion of cells in G1 and Nocadazole to enhance proportion of cells in G2/M. H3 levels and WT protein levels are shown as loading control.
f) Box plots show average methylation of class 3–1 targets in BJ WGBS, BJFOXA2 ChIP-BS and BJFOXA2-CDT1 ChIP-BS data. Calculated based on regions that had at least 10X coverage. Boxes indicate interquartile range and whiskers show maximum and minimum values. Outliers are removed.

