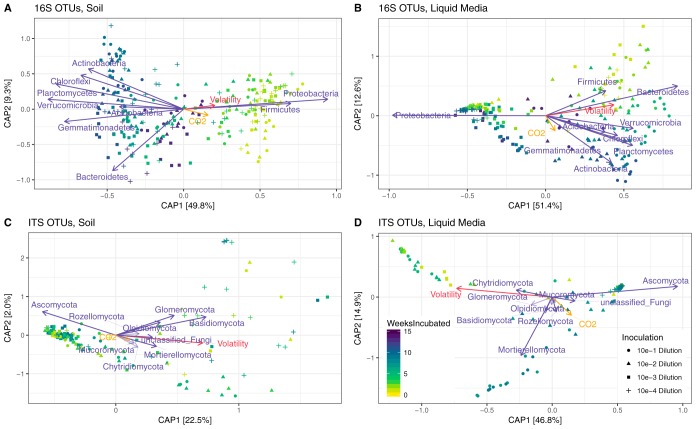
FIG 3.
The biological and physical variables correlated with beta diversity. Ordinations present canonical analysis of principal coordinates (CAP) of weighted UniFrac distances between samples. The percent variation captured by the vectors is shown on each axis. Each vector has a magnitude (length) and direction of a variable’s contributions to the principal components. Vectors represent respiration (CO2 per hour) (orange), volatility (red), and the most abundant phyla (purple).

