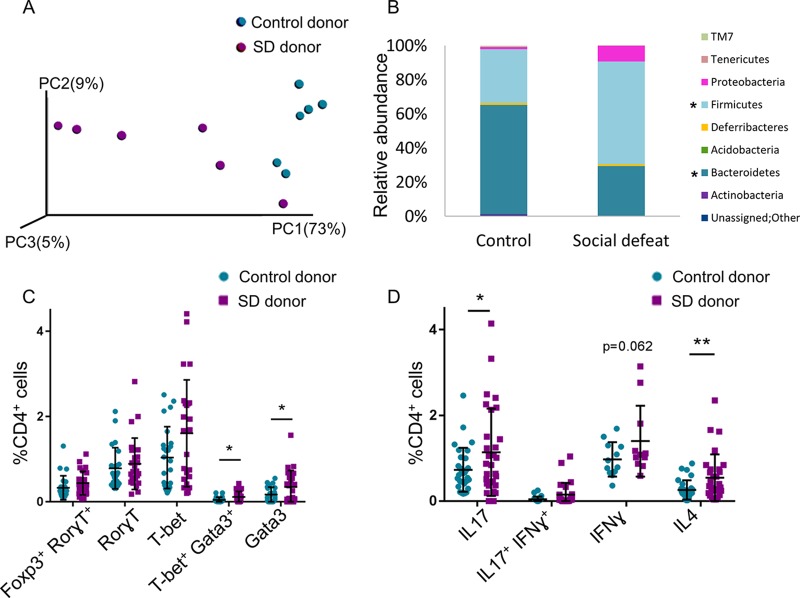
FIG 3.
Effects of social stress on immune regulation are imprinted on the gut microbiota. (A and B) PCoA plot of weighted UniFrac distances (P value = 0.001) (A) and taxon summary plot of bacterial populations at the MLNs of GF Swiss Webster mice (B) 12 days after fecal transplantation from control and SD group C57BL/6 mice. (C and D) Flow cytometry with anti-lineage-specifying transcription factors (C) and cytokine antibodies (D), as indicated, 12 days after fecal transplantation from control and SD group C57BL/6 mice. For panel C, n = 24 from 4 independent experiments; for panel D, n = 11 to 24 from 2 to 4 independent experiments. Means were significantly different using one-tailed t test as follows: *, P value < 0.05; **, P value < 0.01; and ***, P value < 0.001. Error bars represent standard deviations; see also Table S3.

