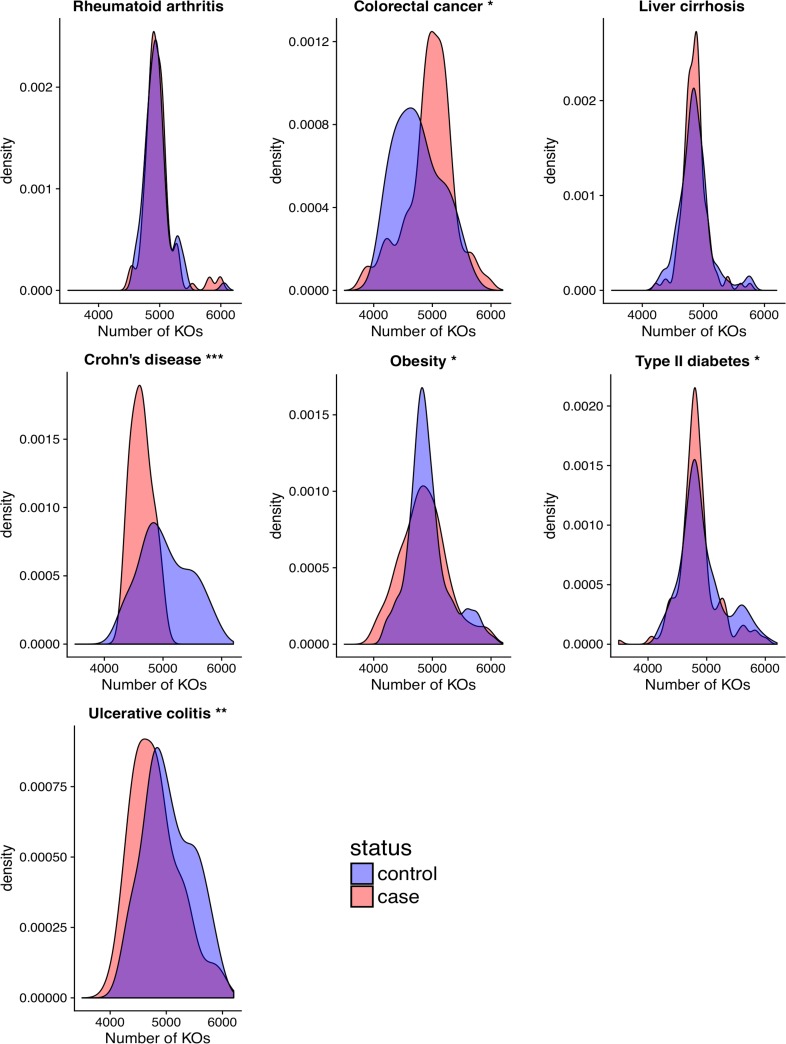
FIG 1.
Protein family richness associates with disease. Density plots of the distribution of protein family richness across case and control populations for the seven diseases. Asterisks beside plot titles indicate significance from Student’s t test (*, P < 0.05; **, P < 0.01; ***, P < 0.001). Similar results were observed with Kolmogorov-Smirnov and Kruskal-Wallis tests.

