Fig. 3.

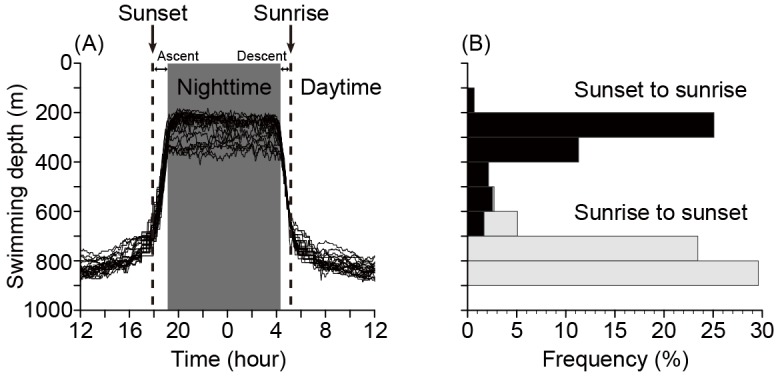
Fig. 3. (A) Swimming depths of EEL-B with all daily data superimposed. The vertical migrations were separated into 4 phases by sunset, sunrise, end point of ascending and start point of descending for the analyses of this study. (B) Frequency of EEL-B depth records separated into daytime (gray) and nighttime (black) periods.
