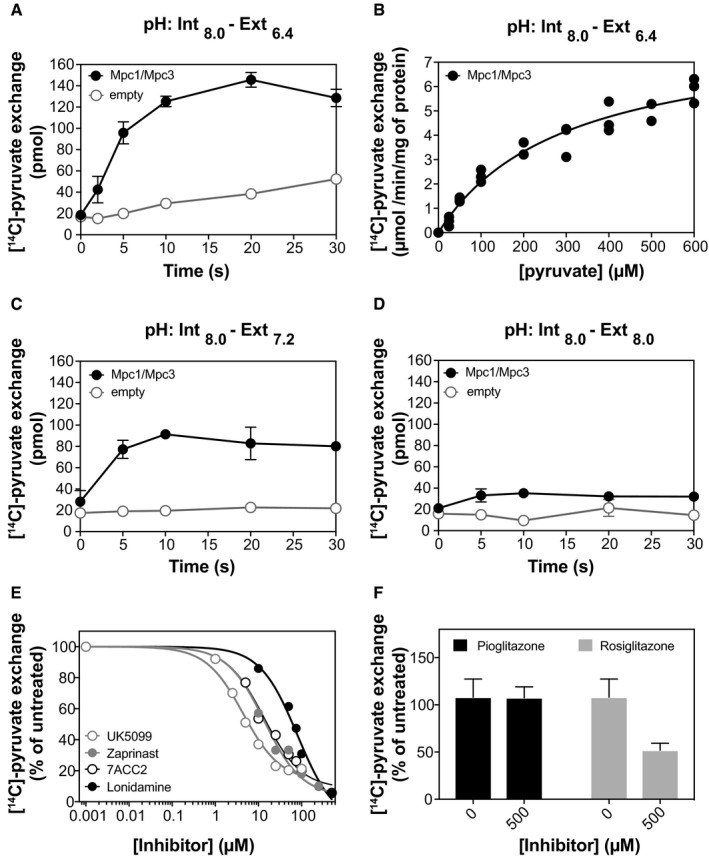
Time course of pyruvate homo‐exchange by the Mpc1/Mpc3 hetero‐complex in liposomes (n = 8) in comparison with empty liposomes (n = 6) at a ΔpH of 1.6.
Kinetic analysis of pyruvate homo‐exchange at ΔpH of 1.6 (n = 3). The hetero‐complex was assayed for initial rates of uptake in the concentration range of 25–600 μM. The calculated K
M was 299 μM in this experiment and 318 and 409 μM in two additional biological repeats.
Time course of pyruvate homo‐exchange by the Mpc1/Mpc3 hetero‐complex in physiological pH (n = 4) compared to empty liposomes (n = 4).
In the absence of a ΔpH, the time course of pyruvate homo‐exchange was similar for the Mpc1/Mpc3 proteoliposomes and the empty liposomes (n = 4).
Inhibition of [14C]‐pyruvate homo‐exchange by UK5099 (1–100 μM), Zaprinast (1–1,000 μM), lonidamine (10–10,000 μM) and 7ACC2 (5–500 μM). Data points represent the mean of three technical replicates of a typical experiment. The IC50 measurements have also been independently replicated, three times for UK5099, Zaprinast and 7ACC2 (average IC50: 9 ± 7, 18 ± 8 and 27 ± 13 μM, respectively) and two times for lonidamine (average IC50: 118 ± 24 μM).
[14C]‐pyruvate homo‐exchange inhibition by the TZDs, pioglitazone and rosiglitazone (n = 6).
Data information: Data have been independently replicated: (A) four biological repeats, (B) three biological repeats, (C, D) two biological repeats, (E, F) three biological repeats for UK5099, Zaprinast, 7ACC2 and two biological repeats for lonidamine and the TZDs. The error bars represent the standard error of the mean in (A) and the standard deviation in (C, D and F).

