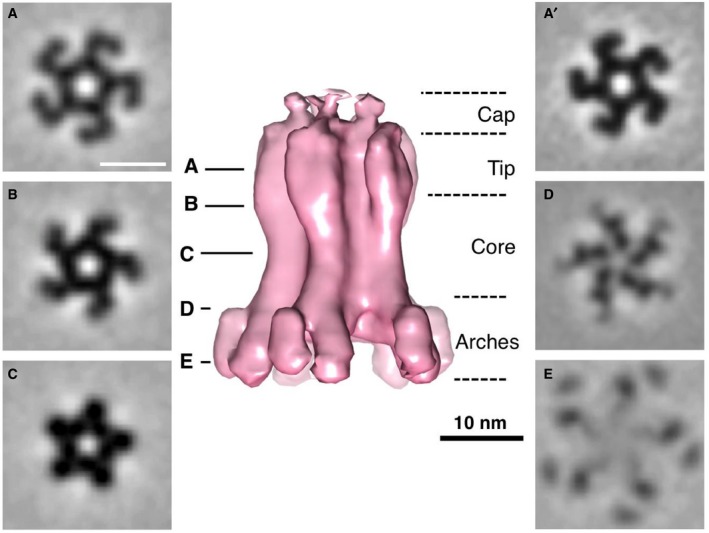
Isosurface of the subtomogram average (in pink) with an applied C5 symmetry and 0.69 nm tomographic slices (A–E) at the indicated heights. Scale bars 10 nm. The average is shown in side view, whereas the slices represent perpendicular slices. The 5 pairs of pillars formed a narrow central channel and separated into 10 arches towards the base (base not visible at the used threshold). The division of the structure into subparts was adapted from Durand
et al (
2015). Subvolumes were extracted from cryotomograms of ghost cells and FIB‐milled intact
Escherichia coli BL21 cells heterologously expressing TssJLM.