
Figure 2. Position of TssJLM in the cell envelope.
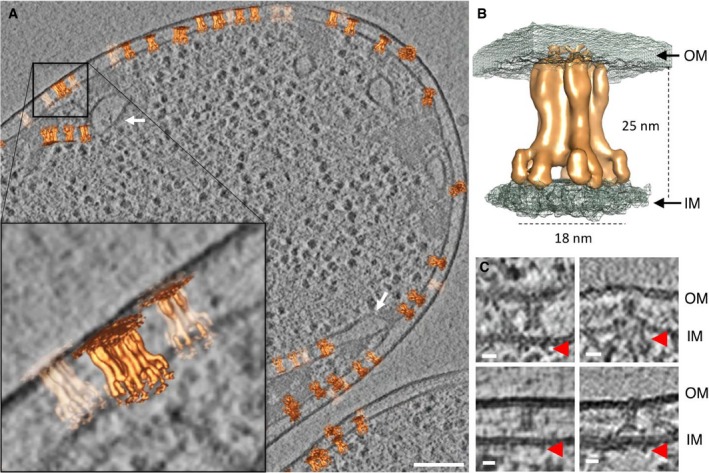
- Slice (9.7 nm) through a cryotomogram of a FIB‐milled Escherichia coli BL21 cell expressing TssJLM. The average shown in Fig 1 was placed back at the positions and orientations of the individual subvolumes that were used to generate the final average. The zoomed‐in area highlights the position of the TssJLM particles within the inner and the outer membrane. Some particles were found in cytoplasmic membrane invaginations, as indicated by white arrows. Scale bar 100 nm.
- Isosurface of the final average (orange) merged with the isosurface of a second average (with higher threshold; grey mesh). The panel shows the positioning of TssJLM with respect to both inner (IM) and outer membranes (OM). The distances corresponded to the widest and longest dimensions of the TssJLM complex.
- Cryotomographic slices (9.7 nm) showing side views of TssJLM. In these examples, the basal parts of TssJLM (red arrows) could be seen extending into the cytoplasm. Scale bar 10 nm.