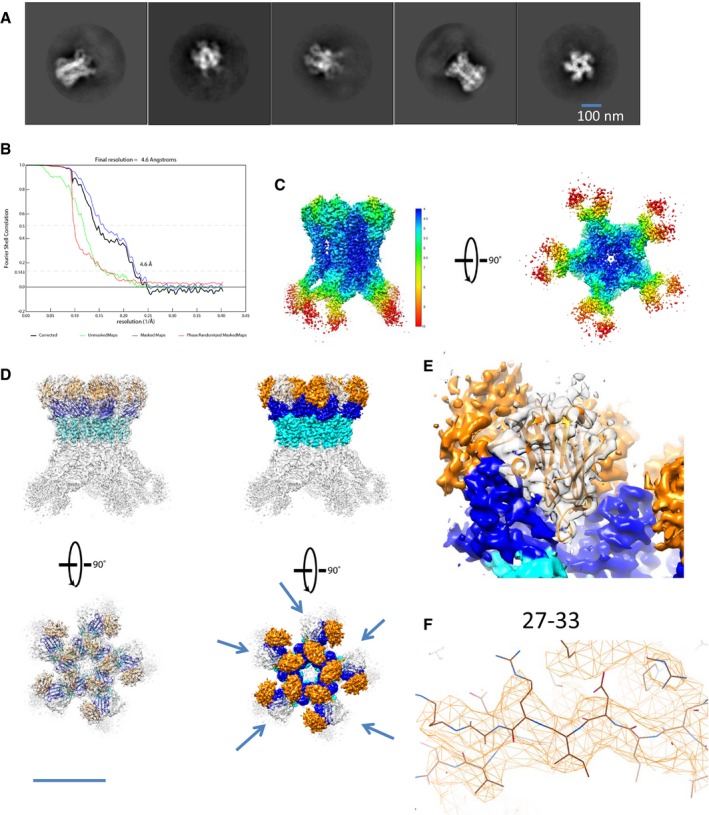
Figure EV2. The cryo‐EM reconstruction of the core of the membrane complex (MC).

- 2D classes of the subtracted SPA cryo‐EM density corresponding to the core of the MC
- FSC curve of the core complex as calculated using post‐process
- 3D representation of the core 3D reconstruction coloured according to the local resolution. Two views are shown.
- Fitting of 10 TssM‐TssJ pseudoatomic models from the crystal structure (4Y7O) in the core cryo‐EM density locally sharpened. The cryo‐EM density was coloured according to the fitted structure. The five additional densities are highlighted by arrows pointing at them. Two views of the complexes are shown. In orange is the TssJ, in blue the beta sheet‐rich region and in cyan the alpha helical domain.
- Transparent representation of the cryo‐EM density in which the third TssJ was fitted (ribbon diagram in orange). The colouring follows that in (D).
- Representative cryo‐EM density, corresponding to the TssJ′ sequence 27–33, with the fitted pseudoatomic model in stick form.
