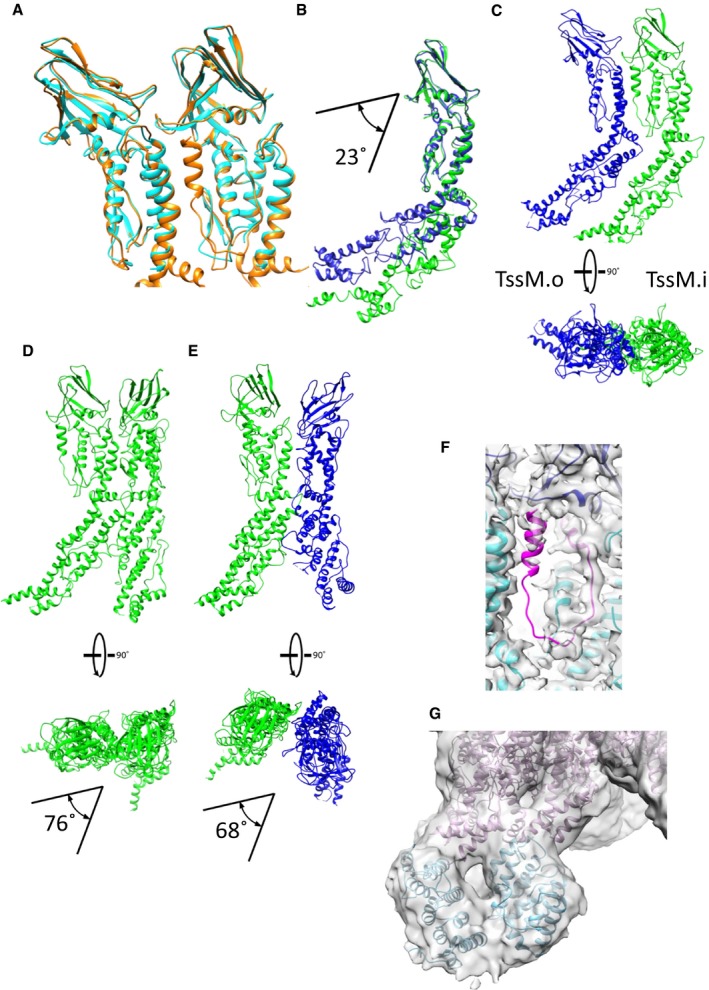
Figure EV4. The TssM pseudoatomic model.

- Comparison between the TssM from the PDB (4Y7O) in cyan and the refined TssM on the cryo‐EM density in orange.
- Comparison of the pseudoatomic model of TssM in the internal (green) and in the external (blue) pillars.
- Interaction interfaces between the internal TssM.a and the external TssM.A within the complex.
- Interaction interfaces between the internal pillars TssM.a and TssM.a+1. The two pillars are twisted at 76° with respect to one another.
- Interaction interfaces between the internal pillar TssM.a and the external TssM.A+1. The two pillars are twisted at 68° with respect to one another.
- Weak C‐terminal density of TssM (1109–1129) in pink.
- The unsharpened density map of the whole complex at a contour level of 0.0055. The TssM foot domain (in blue) between amino acids 382 and 570 predicted structure by RaptorX fits into the density. The two feet converge upon arriving at the membrane level. The rest of the pseudoatomic model of TssM is in pink.
