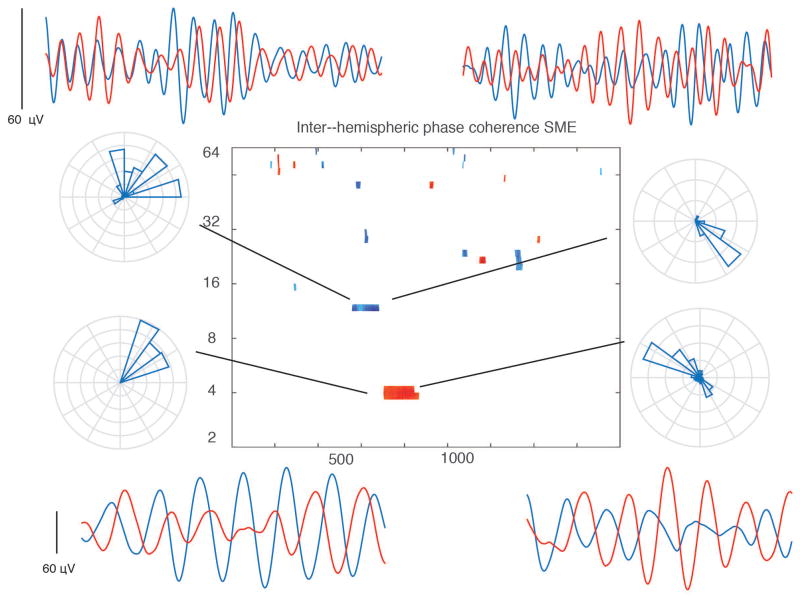
Figure 5. Inter–hippocampal connectivity during item encoding.
Time–frequency plot at center shows pixels across 12 subjects (t–test between recalled and non–recalled PLS distributions) that exhibit a significant SME (p < 0.05 for one continuous half cycle of oscillation), indicating greater connectivity during successful item encoding between left and right hippocampi at 4 Hz. There is decreased connectivity at ~10 Hz. Red colors indicate greater connectivity during successful encoding, blue colors indicate less connectivity. Surrounding plots are individual examples of filtered waves (single trials from individual electrodes, one from each hemisphere, 1800 msec time series) and rose plot histograms indicate there is significant heterogeneity in the phase offset across electrodes for each frequency range, precluding any inferences regarding left–right directionality from these data.

