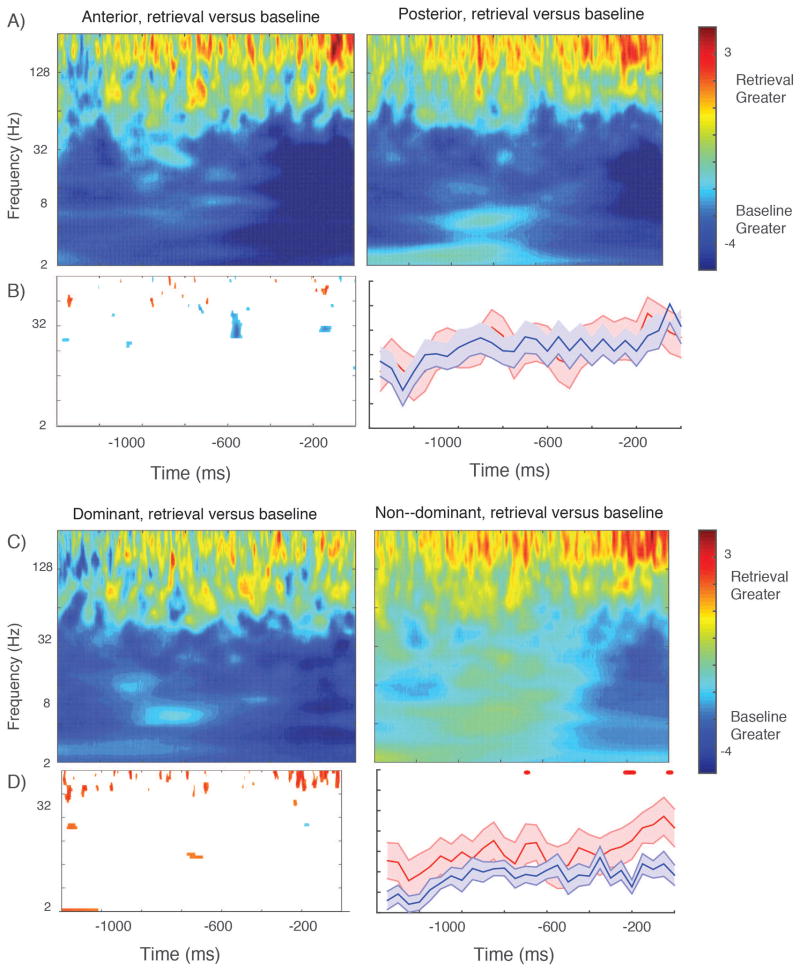
Figure 6. Oscillatory power during item retrieval.
Panel A shows the results of t–test comparing retrieval effect size across all electrodes between anterior and posterior electrode groups. B shows time–frequency points across all electrodes that exceed p < 0.05 for one continuous cycle of an oscillation; this is limited brief differences between anterior and posterior hippocampi in the beta frequency range, related to a greater power decrease relative to baseline in the posterior electrodes. Right panel in B shows results for gamma frequency range across 23 subjects; no points survive Bonferroni correction for one continuous half cycle. C shows the comparison between the dominant and non–dominant hemisphere across all electrodes. The low frequency power decrease occurs immediately prior to item retrieval in the non–dominant hemisphere versus throughout the time series in the dominant hemisphere, visible in the direct comparison between electrode sets in D, left plot. The most striking difference is in the high gamma range, for which a power increase relative to baseline is stronger in the non–dominant hemisphere. This difference survives Bonferroni correction at the subject level (D, right panel.)

