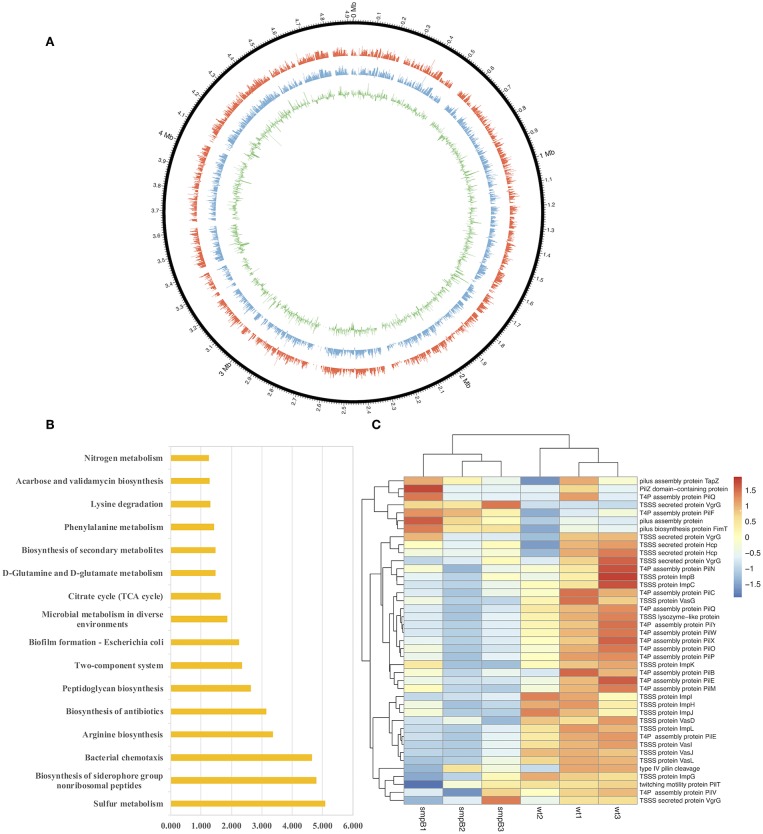
Figure 1.
Transcriptomic analysis between wild type and smpB knockout. (A) Circos diagram of read distribution and gene expression. From inside, green (fold change of gene expression between ΔsmpB and wild type), blue (mRNA expression of wild type A. veronii by rpkm), red (mRNA expression of ΔsmpB by rpkm), black (reads distribution on the reference genome NZ_CP012504.1). (B) Pathways affected by smpB. The horizontal and vertical axes represented as –log(p) value and the pathway names (p < 0.05). (C) Heat map representing the expressions of type IV pilus assembly, type VI secretion system and outer membrane genes.

