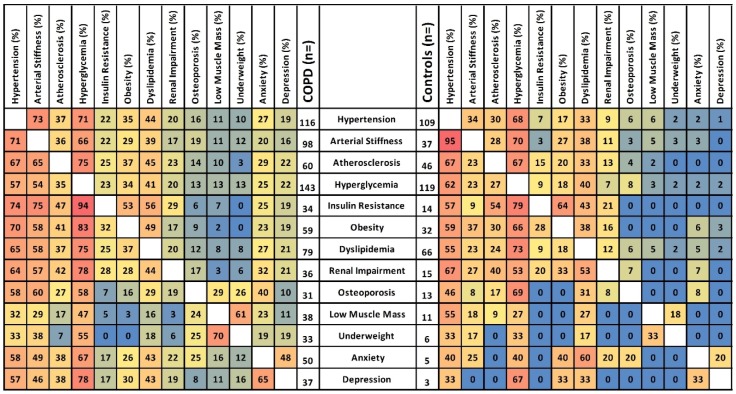
Figure 3.
Co-existence of (co)morbidities in COPD and controls. The frequencies of co-existing (co)morbidities (%, ranging from 0 to 100%, horizontal row) in the presence of every index morbidity (vertical column) in COPD (left) and controls (right) are shown. These are descriptive data and do not offer a statistical comparison. For interpretation, the cells are color filled: red indicating the highest values, blue the lowest, and yellow for those in between.

