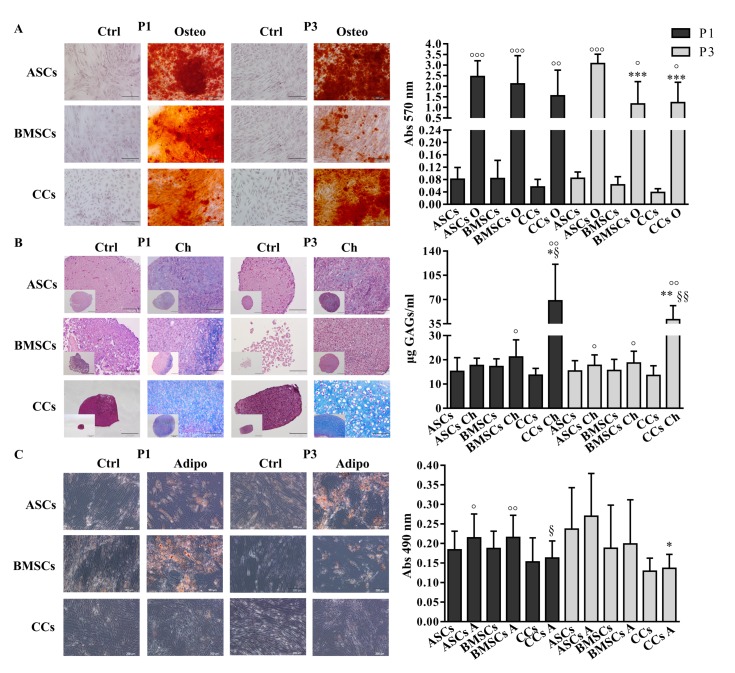
Figure 2.
Multi-differentiation potential. (A) Osteogenic-O (Alizarin red staining), (B) Chondrogenic-Ch (Alcian blue staining and GAG quantification), and (C) Adipogenic-A (Oil O red staining) differentiation potential assessment. Adipose (ASCs)-, bone marrow (BMSCs)-derived MSCs and cartilage cells (CCs) obtained from the same eight donors were subjected to differentiation at P1 and P3. Scale bars correspond to 200 μm. Only scale bars of the biggest Chondrogenic-Ch images correspond to 100 µm. * p < 0.05, ** p < 0.01, *** p < 0.001 vs. ASCs, § p < 0.05, §§ p < 0.01 vs. BMSCs, ° p < 0.05, °° p < 0.01, °°° p < 0.001 vs. control. Data are represented as mean ± SD (n = 8).

