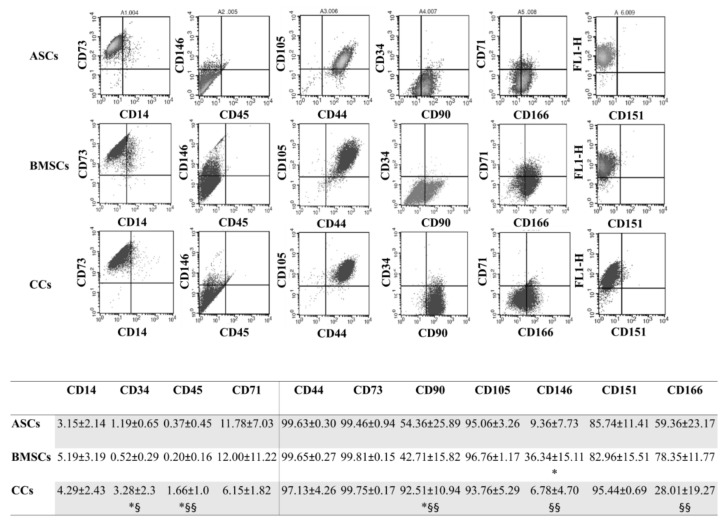
Figure 3.
Immunophenotype. Representative expression of the typical pattern of MSC surface markers in all the analyzed cells, with a table reporting the percentages of positive cells for the whole panel of surface markers tested at P4. Adipose (ASCs)-, bone marrow (BMSCs)-derived MSCs, and cartilage cells (CCs). * p < 0.05 vs. ASCs, § p < 0.05, §§ p < 0.05 vs. BMSCs. Data are expressed as mean ± SD (n = 5).

