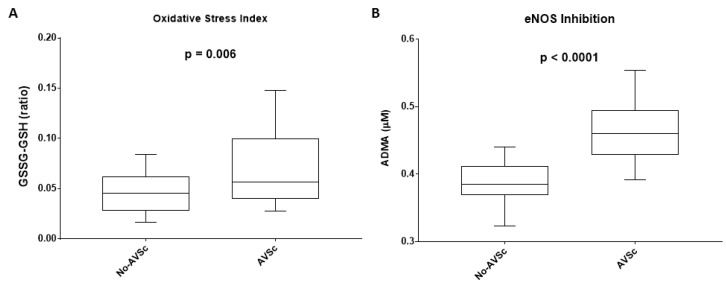
Figure 1.
Imbalance of systemic glutathione homeostasis and endothelial dysfunction. (A) Box plot representing the ratio between the reduced (GSH) and the oxidized (GSSG) forms of glutathione in patients with normal aortic valve leaflet (No-AVSc; n = 29) and aortic valve sclerosis (AVSc; n = 29). (B) Box plot representing ADMA levels in patients with No-AVSc (n = 29) and AVSc (n = 29).

