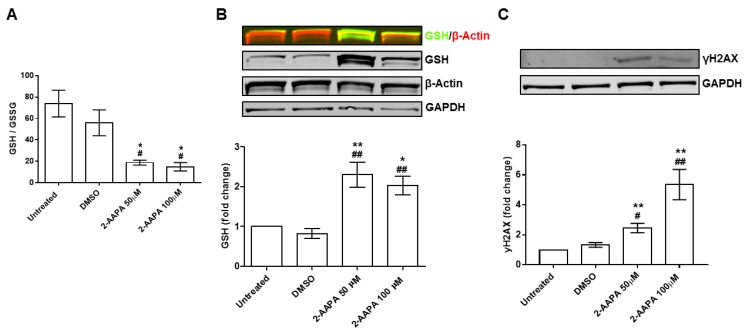
Figure 3.
In vitro model of protein S-glutathionylation. (A) Bar graph representing the ratio between the reduced (GSH) and the oxidized (GSSG) form of glutathione (GSH/GSSG ratio) in human umbilical vein endothelial cells (HUVEC) after 4 h of treatment (2-AAPA 50 and 100 μM) and 24 h of recovery (n = 3). (B) Western blot representative images of HUVEC treated with 2-AAPA (50 and 100 μM) for 4 h and 24 h of recovery (n = 4); GSH is shown in green and β-actin is shown in red; Bar graph representing Western blot quantification by ImageJ. (* p < 0.05 vs. Untreated; ** p < 0.001 vs. Untreated; ## p < 0.001 vs. Dimethyl Sulfoxide (DMSO)). (C) Western blot evaluation of histone 2AX phosphorylation (γH2AX) in HUVEC after 2-AAPA (50 and 100 μM) treatment for 4 h and 24 h of recovery (n = 4); Bar graph representing Western blot quantification by ImageJ. (** p < 0.001 vs. Untreated; # p < 0.05 vs. DMSO; ## p < 0.01 vs. DMSO). Glyceraldehyde-3-Phosphate Dehydrogenase (GAPDH) has been used for normalization.

