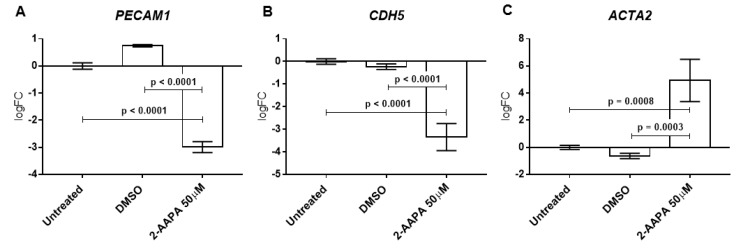
Figure 4.
Protein S-glutathionylation and endothelial-to-mesenchymal transition. Quantitative Polymerase Chain Reaction (qPCR) of the gene encoding endothelial markers (A) CD31, (B) VE-cadherin and mesenchymal marker (C) ACTA2 after 4 h of 2-AAPA (50 μM) treatment and 48 h of recovery (n = 3). qPCR data are expressed as log2 fold change (logFC) in comparison to untreated cells.

