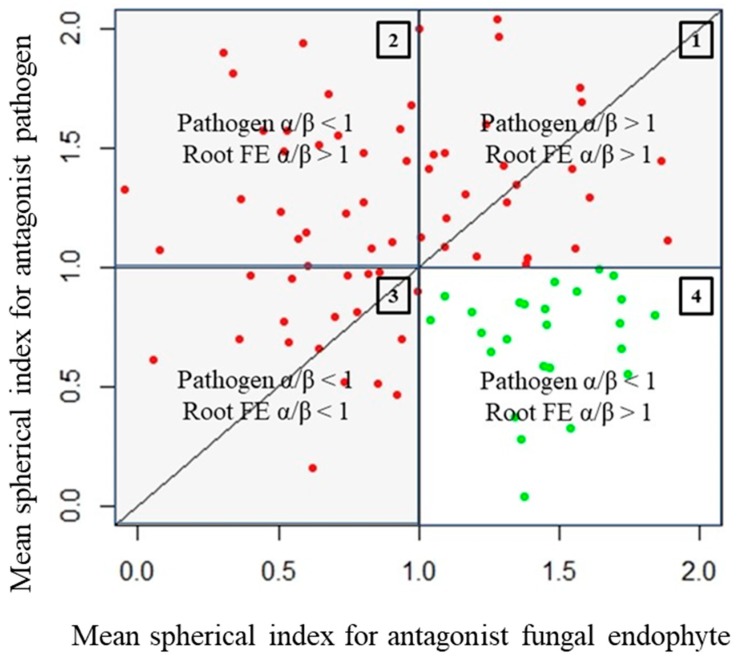
Figure 3.
A graph of the mean spherical indices of a set of root fungal endophyte (FE) antagonists plotted against their single test pathogen. This is a simulated dataset generated from a random distribution (n = 100, mean = 1, standard deviation = 0.5) that mimics empirical data observed in this experiment. In the graph above, the data points coloured green are non-spurious instances of successful antagonistic interaction while the red data points indicate spurious ones.

