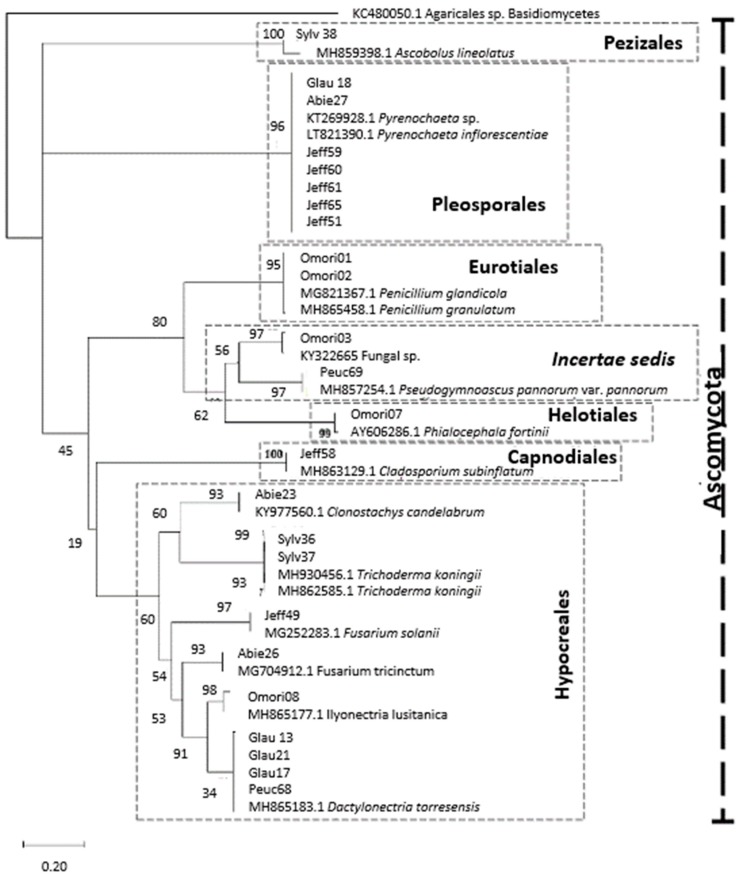
Figure 4.
Molecular phylogenetic analysis by maximum likelihood (ML) based on concatenated ITS sequences. The percentage of replicate trees in which the associated taxa clustered together in the bootstrap test are shown next to the branches. Also indicated are the orders to which the samples belong to (dashed rectangles w/descriptions), the phylum (dashed vertical bar), and the outgroup taxon (the Basidiomycete KC480050.1 Agaricales sp. isolated from P. abies by Terhonen et al. [19].

